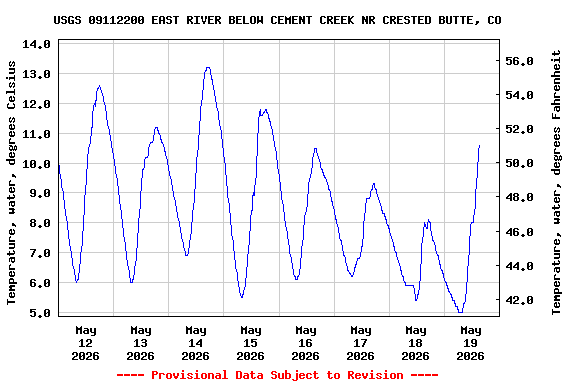
Most recent instantaneous value: 10.6 05-19-2026 15:15 MDT
See this graph on the Monitoring Location Pages
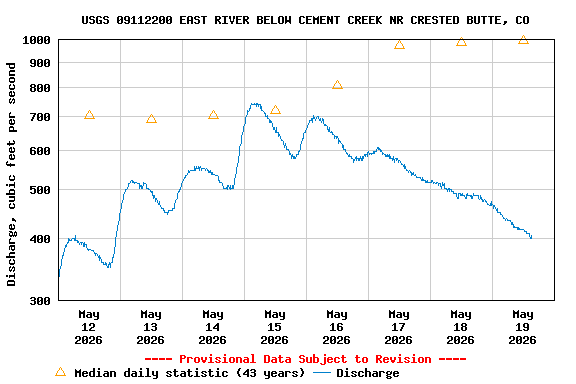
| Min (1981) | Most Recent Instantaneous Value May 19 | 25th percen- tile | Median | Mean | 75th percen- tile | Max (2009) |
|---|---|---|---|---|---|---|
| 286 | 404 | 704 | 996 | 1130 | 1420 | 2480 |
![]() U.S. Department of the Interior |
U.S. Geological Survey
U.S. Department of the Interior |
U.S. Geological Survey
Title: USGS Current Conditions for the Nation
URL:
Page Contact Information: Colorado Water Data Support Team
Page Last Modified: 2026-05-19 17:38:37 EDT
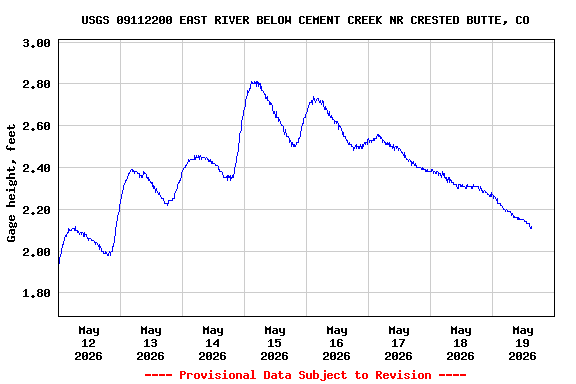
2.41 1.82 caww01