USGS 12340000 Blackfoot River near Bonner MT

PROVISIONAL DATA SUBJECT TO REVISION

Click to hidestation-specific text
Flood Tracking - Stage Flood Tracking - Discharge Gage-height Corrections Base Rating Shifted Rating
(About shift-adjusted ratings).

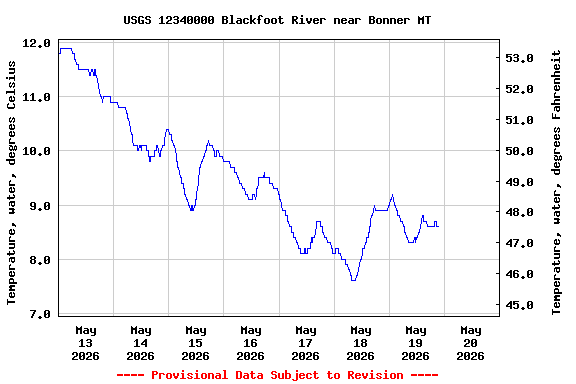
UPDATED September 30, 2021: USGS current water temperature monitoring information will continue at this site. New funding sources have been identified and details are being worked out.
Station operated by the USGS Wyoming-Montana Water Science Center as part of the Federal Priority Streamgages network.
Leaving USGS: U.S. Coast Guard boating safety tips.
This station managed by the Helena Field Unit.

Available Parameters Available Period
  
2008-08-24  2026-01-19
1990-10-13  2026-01-19
2007-10-01  2026-01-19


 (7)
 

  -- or --


Summary of all available data for this site
Instantaneous-data availability statement


Temperature, water, degrees Celsius

Most recent instantaneous value: 0.0 01-19-2026   07:30 MST
Graph of  Temperature, water, degrees Celsius

Add up to 2 more sites and replot for "Temperature, water, degrees Celsius"

?


Create presentation-quality / stand-alone graph.   Subscribe to WaterAlert      

See this graph on the Monitoring Location Pages


Discharge, cubic feet per second

Most recent instantaneous value: 919 01-19-2026   07:30 MST
Graph of  Discharge, cubic feet per second

Add up to 2 more sites and replot for "Discharge, cubic feet per second"

?


Create presentation-quality / stand-alone graph.   Subscribe to WaterAlert      

See this graph on the Monitoring Location Pages


Daily discharge, cubic feet per second -- statistics for Jan 19 based on 90 water years of record more
Min
(1940)
25th
percen-
tile
Median Mean 75th
percen-
tile
Most Recent
Instantaneous
Value Jan 19
Max
(1976)
220 440 523 567 642 919 1470


Gage height, feet

Most recent instantaneous value: 2.56 01-19-2026   07:30 MST
Graph of  Gage height, feet

Add up to 2 more sites and replot for "Gage height, feet"

?


Create presentation-quality / stand-alone graph.   Subscribe to WaterAlert      

See this graph on the Monitoring Location Pages