Warning: Javascript must be enabled to use all the features on this page!


Page Loading - Please Wait...

Click to hideNews Bulletins
! This page is undergoing modernization with expected decommissioning as key features are added to the modernized pages.
Learn more about our modernization plans to find out which options will suit you best. Next Generation Monitoring Location Page is available now.
A beta version of the My Favorites page is available in WDFN. Try it out and tell us what you think at wdfn@usgs.gov
USGS 12413860 COEUR D ALENE RIVER NR HARRISON ID

PROVISIONAL DATA SUBJECT TO REVISION

Click to hidestation-specific text
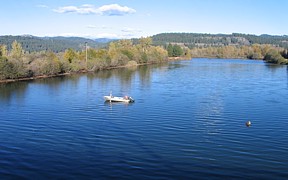
Coeur d'Alene River near Harrison, ID - USGS file photo

Station is operated in cooperation with the U.S. Environmental Protection Agency .

This station managed by the Post Falls Field Office.

Available Parameters Available Period
  
2004-03-01  2026-10-16
2007-10-01  2026-10-16
2026-02-12  2026-10-16
2026-02-12  2026-10-16
2026-03-25  2026-10-16
2026-02-12  2026-10-16
2026-02-12  2026-10-16
2026-02-12  2026-10-16
2026-06-18  2026-10-16


 (7)
 

  -- or --


Summary of all available data for this site
Instantaneous-data availability statement

Most recent instantaneous value: 108 10-16-2026   13:30 PDT
Graph of  Discharge, cubic feet per second

Add up to 2 more sites and replot for "Discharge, cubic feet per second"

?


Create presentation-quality / stand-alone graph.   Subscribe to WaterAlert      

See this graph on the Monitoring Location Pages


Daily discharge, cubic feet per second -- statistics for Oct 16 based on 22 water years of record more
Most Recent
Instantaneous
Value Oct 16
Min
(2016)
25th
percen-
tile
Median Mean 75th
percen-
tile
Max
(2017)
108 317 420 493 550 604 1550

Most recent instantaneous value: 23.38 10-16-2026   13:45 PDT
Graph of  Gage height, feet

Add up to 2 more sites and replot for "Gage height, feet"

?


Create presentation-quality / stand-alone graph.   Subscribe to WaterAlert      

See this graph on the Monitoring Location Pages


Most recent instantaneous value: 107 10-16-2026   13:45 PDT
Graph of  Specific conductance, water, unfiltered, microsiemens per centimeter at 25 degrees Celsius

Add up to 2 more sites and replot for "Specific conductance, water, unfiltered, microsiemens per centimeter at 25 degrees Celsius"

?


Create presentation-quality / stand-alone graph.   Subscribe to WaterAlert      

See this graph on the Monitoring Location Pages


Most recent instantaneous value: 10.3 10-16-2026   13:45 PDT
Graph of  Dissolved oxygen, water, unfiltered, milligrams per liter

Add up to 2 more sites and replot for "Dissolved oxygen, water, unfiltered, milligrams per liter"

?


Create presentation-quality / stand-alone graph.   Subscribe to WaterAlert      

See this graph on the Monitoring Location Pages


Most recent instantaneous value: 7.6 10-16-2026   13:45 PDT
Graph of  pH, water, unfiltered, field, standard units

Add up to 2 more sites and replot for "pH, water, unfiltered, field, standard units"

?


Create presentation-quality / stand-alone graph.   Subscribe to WaterAlert      

See this graph on the Monitoring Location Pages


Most recent instantaneous value: 1.36 10-16-2026   13:45 PDT
Graph of  Chlorophyll relative fluorescence (fChl), water, in situ, relative fluorescence units (RFU)

Add up to 2 more sites and replot for "Chlorophyll relative fluorescence (fChl), water, in situ, relative fluorescence units (RFU)"

?


Create presentation-quality / stand-alone graph.   Subscribe to WaterAlert      

See this graph on the Monitoring Location Pages


Most recent instantaneous value: 0.17 10-16-2026   13:45 PDT
Graph of  Phycocyanin relative fluorescence (fPC), water, in situ, relative fluorescence units (RFU)

Add up to 2 more sites and replot for "Phycocyanin relative fluorescence (fPC), water, in situ, relative fluorescence units (RFU)"

?


Create presentation-quality / stand-alone graph.   Subscribe to WaterAlert      

See this graph on the Monitoring Location Pages


Most recent instantaneous value: 1.4 10-16-2026   13:45 PDT
Graph of  Turbidity, water, unfiltered, monochrome near infra-red LED light, 780-900 nm, detection angle 90 +-2.5 degrees, formazin nephelometric units (FNU)

Add up to 2 more sites and replot for "Turbidity, water, unfiltered, monochrome near infra-red LED light, 780-900 nm, detection angle 90 +-2.5 degrees, formazin nephelometric units (FNU)"

?


Create presentation-quality / stand-alone graph.   Subscribe to WaterAlert      

See this graph on the Monitoring Location Pages


Most recent instantaneous value: 13.9 10-16-2026   13:45 PDT
Graph of  DCP battery voltage, volts

Add up to 2 more sites and replot for "DCP battery voltage, volts"

?


Create presentation-quality / stand-alone graph.   Subscribe to WaterAlert      

See this graph on the Monitoring Location Pages