USGS 261533080571600 L-28 INTERCEPTOR CANAL BLW S-190 NEAR CLEWISTON FL

PROVISIONAL DATA SUBJECT TO REVISION

Click to hidestation-specific text

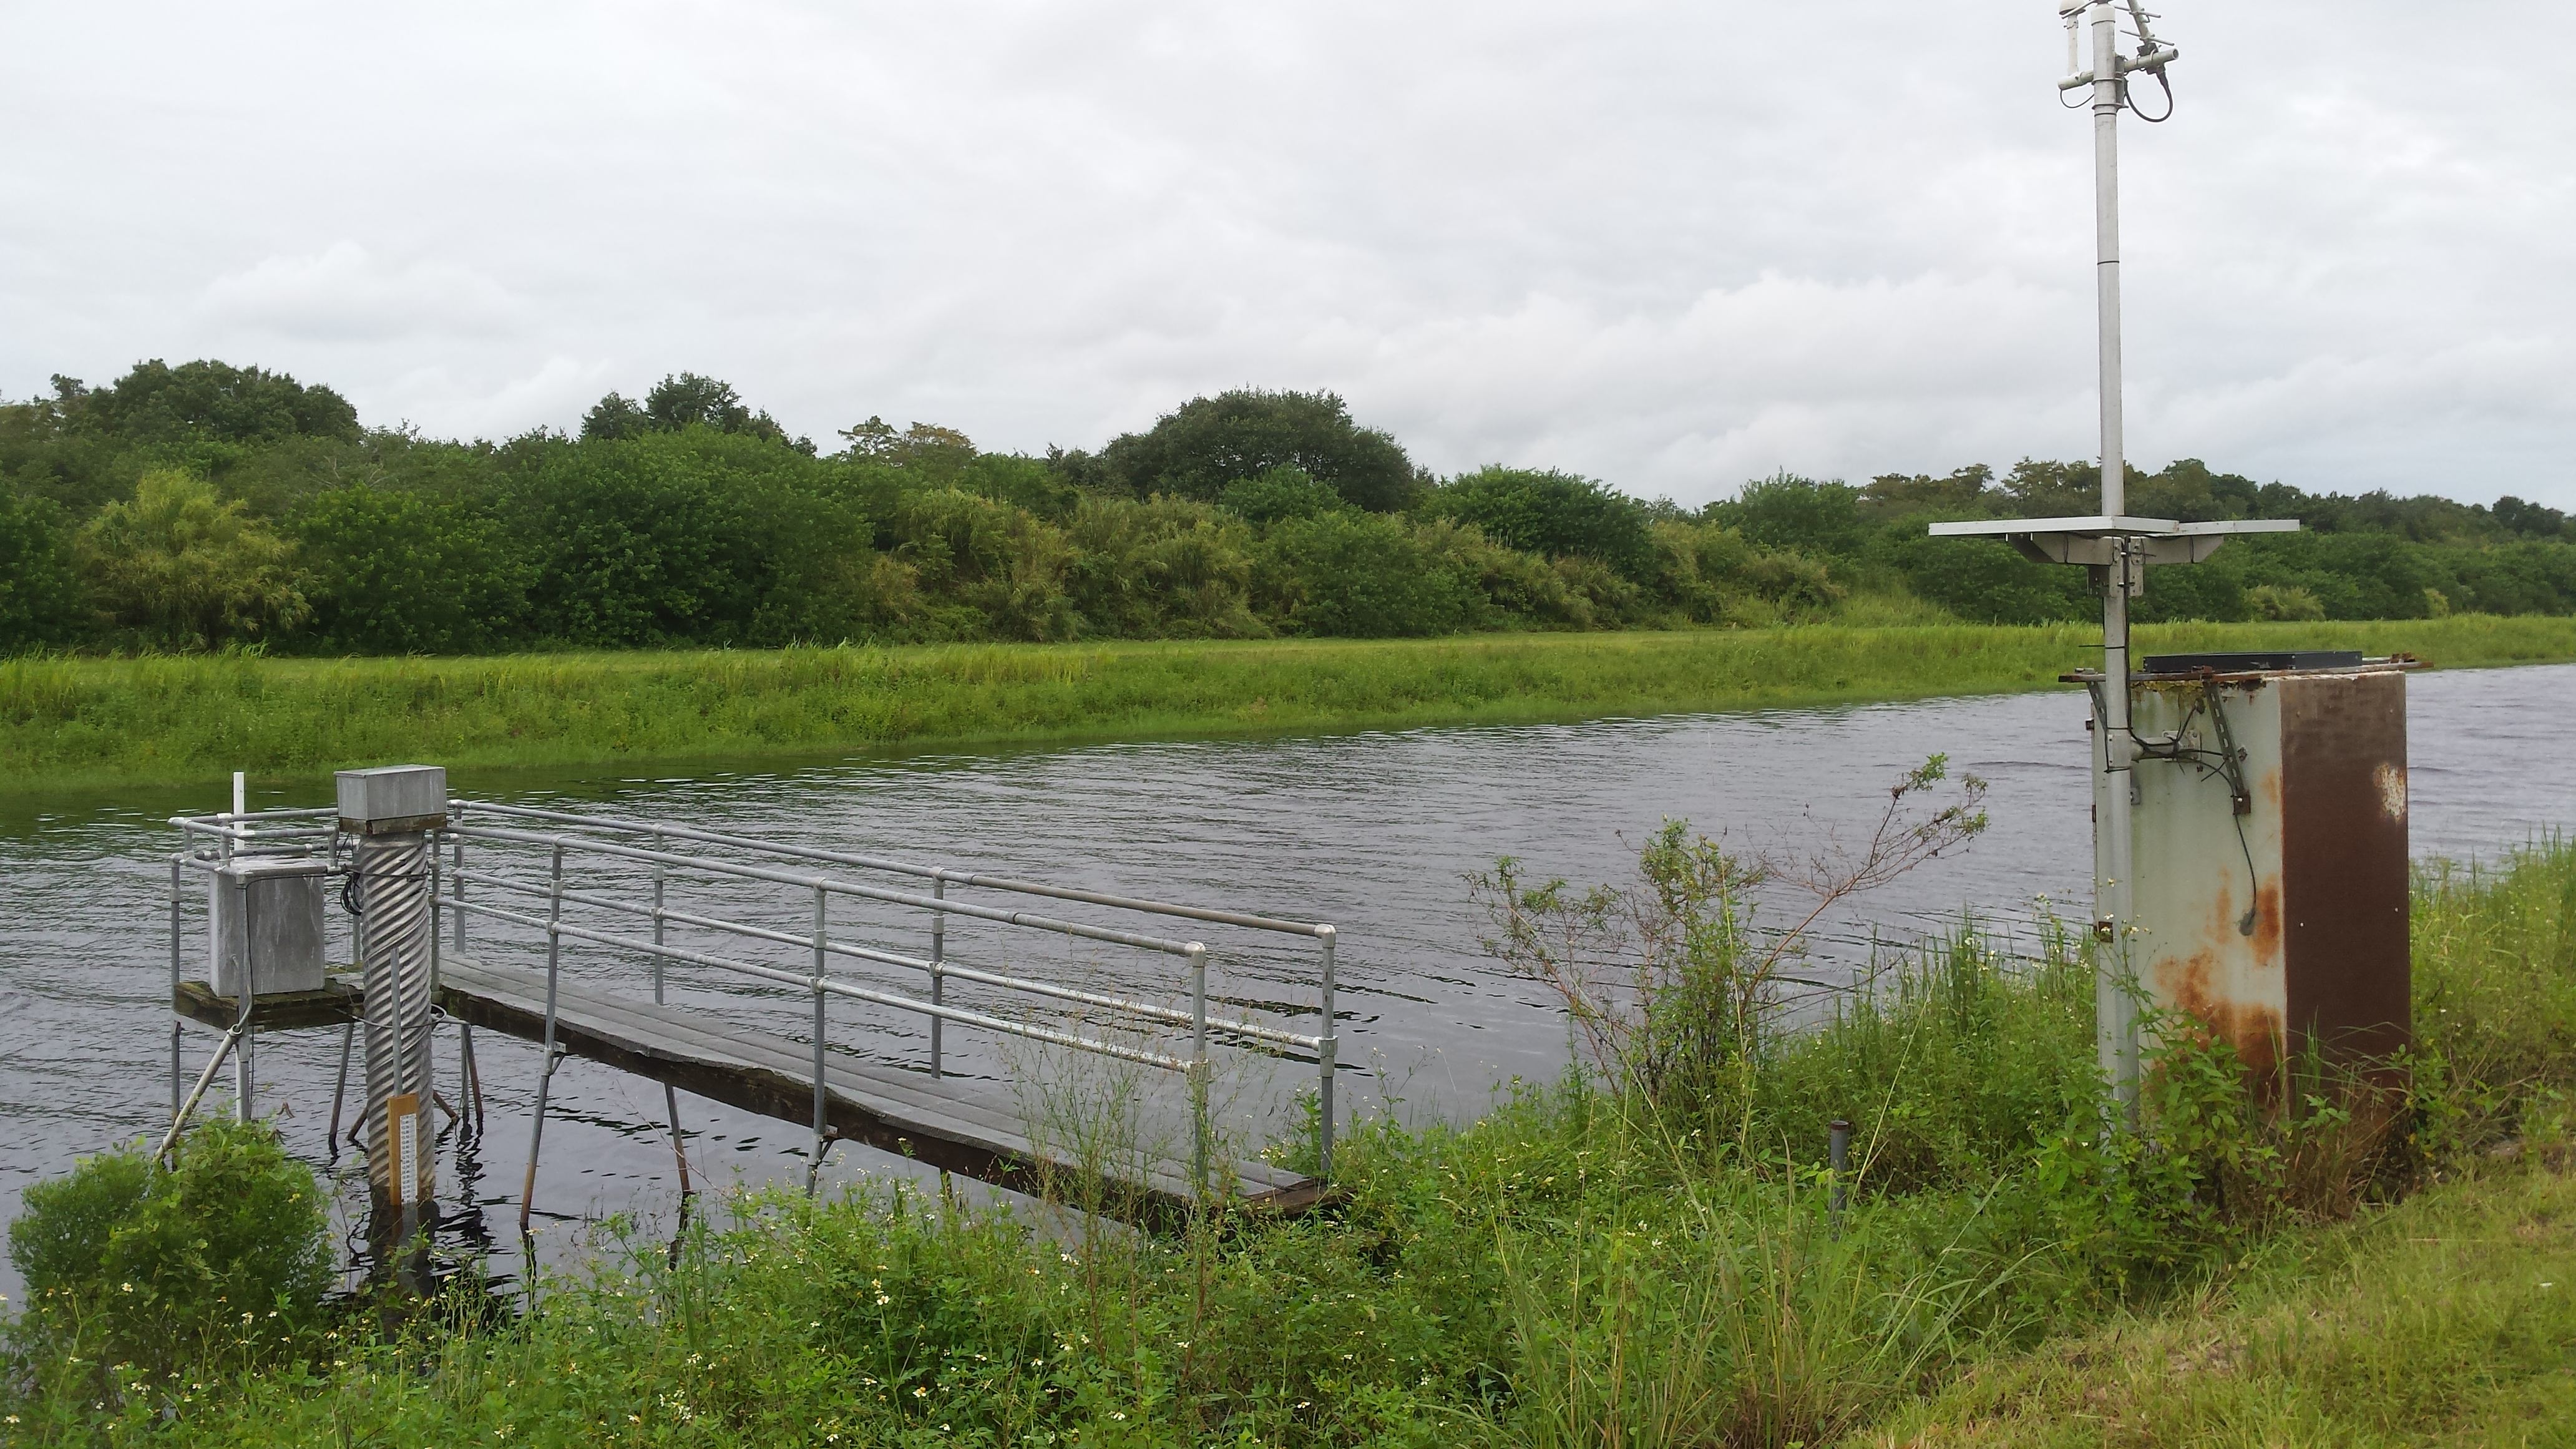
This gage is monitored in cooperation with the Seminole Tribe of Florida

Link to the Seminole Tribe of Florida.

L-28 Interceptor Canal Blw. S-190 near Clewiston Gage. </p


Computed discharge at this station may differ from individual measurements because 
of changes in tidal influence, wind, or other factors.


RATING IS UNDER DEVELOPMENT.
Available Parameters Available Period
  
2007-11-28  2024-04-19
2007-10-01  2024-04-19
2014-06-25  2024-04-19
2023-12-21  2024-04-19


 (7)
 

  -- or --


Summary of all available data for this site
Instantaneous-data availability statement


Discharge, cubic feet per second

Most recent instantaneous value: 8.73 04-20-2024   00:00 EDT
Graph of  Discharge, cubic feet per second

Add up to 2 more sites and replot for "Discharge, cubic feet per second"

?


Create presentation-quality / stand-alone graph.   Subscribe to WaterAlert      

See this graph on the Monitoring Location Pages


Daily discharge, cubic feet per second -- statistics for Apr 20 based on 25 water years of record more
Min
(2000)
25th
percen-
tile
Mean Median Most Recent
Instantaneous
Value Apr 20
75th
percen-
tile
Max
(2010)
-78.0 -22 5.7 7.7 8.73 17 264


Gage height, feet, [NGVD29]

Most recent instantaneous value: 11.04 04-20-2024   00:00 EDT
Graph of  Gage height, feet, [NGVD29]

Add up to 2 more sites and replot for "Gage height, feet, [NGVD29]"

?


Create presentation-quality / stand-alone graph.   Subscribe to WaterAlert      

See this graph on the Monitoring Location Pages


Stream water level elevation above NAVD 1988, in feet

Most recent instantaneous value: 9.44 04-20-2024   00:00 EDT
Graph of  Stream water level elevation above NAVD 1988, in feet

Add up to 2 more sites and replot for "Stream water level elevation above NAVD 1988, in feet"

?


Create presentation-quality / stand-alone graph.   Subscribe to WaterAlert      

See this graph on the Monitoring Location Pages


Mean water velocity for discharge computation, feet per second, SW

Most recent instantaneous value: 0.01 04-20-2024   00:00 EDT
Graph of  Mean water velocity for discharge computation, feet per second

Add up to 2 more sites and replot for "Mean water velocity for discharge computation, feet per second, SW"

?


Create presentation-quality / stand-alone graph.   Subscribe to WaterAlert      

See this graph on the Monitoring Location Pages