Warning: Javascript must be enabled to use all the features on this page!


Page Loading - Please Wait...

Click to hideNews Bulletins

Water-Year Summary for Site USGS 03611500

! This page will be decommissioned in early 2026. Modernized Water Year Summary Reports are available in WDFN. Learn more about our modernization plans and timeline.
Click to hide Water-Year Summary instructions and information
  • Water-Year Summary reports summarize a year of hydrologic data in a printer-friendly format.
  • For water years 2014 onward, choose a water year and parameter and an on-demand Water-Year Summary report will be generated.
  • For water years 2006 through 2013, choose a water year and an Annual Water Data Report will be provided.
  • For water years 2005 and earlier, Annual Water Data Reports may be available in digital format.
  • Not all sites have reports available for every water year.
Available Parameters
00060 Discharge(Mean)  

Water year 2014: 2013-10-01 to 2014-09-30
 

Print this page
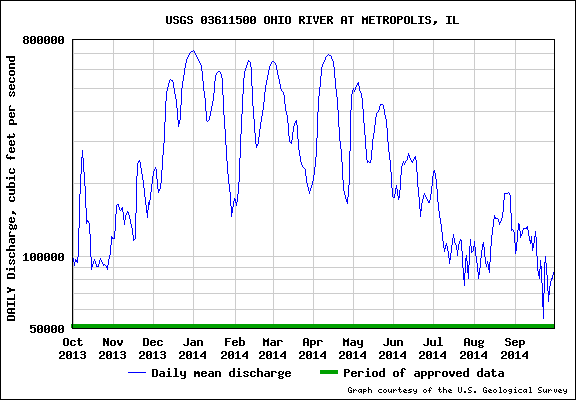
USGS Water-Year Summary 2014
03611500 OHIO RIVER AT METROPOLIS, IL
LOCATION - Lat 37°08'51", long 88°44'27" referenced to North American Datum of 1927, Massac County, IL, Hydrologic Unit 05140206, at TVA Shawnee Steam Plant river coal loading facility at river mile 946.2, about 2.1 miles downstream of previous location on railroad bridge at river mile 944.1 at Metropolis, IL.
DRAINAGE AREA - 203,000 mi².
SURFACE-WATER RECORDS
PERIOD OF RECORD - January 1928 to current year. Prior to April 1928 monthly discharge only, published in WSP 1305. Gage-height records collected 9.6 miles upstream at Paducah since 1890 are contained in reports of National Weather Service. Occasional discharge measurements from 1881 to 1924 in reports of Mississippi River Commission.
GAGE - Water-stage recorder with telemetry. Datum of gage is 276.18 feet above NAVD of 1988. Prior to December 22, 1936, water-stage recorders (temporary installations) at Paducah, Kentucky, Metropolis and Joppa, Illinois, and Dam 52. Auxiliary water-stage recorder near Grand Chain, 0.5 miles upstream from Dam 53, and 18 miles downstream from base gage. Prior to May 29, 1936, auxiliary nonrecording gage at Dam 53.
COOPERATION - U.S. Army Corps of Engineers, Louisville District and National Stream Quality Accounting Network.
REMARKS - 10/01/2013-09/30/2014: Records fair except for estimated daily discharges and for discharges less than 100,000 ft³/s which are poor. Flow regulated by many dams and reservoirs. Maximum daily discharge includes overflow through Bay Creek and Cache River Valleys.
Water-Data Report 2014
03611500 OHIO RIVER AT METROPOLIS, IL -- Continued
DISCHARGE, CUBIC FEET PER SECOND
YEAR 2013-10-01 to 2014-09-30
DAILY MEAN VALUES
Day Oct
 2013
197,800
291,900
396,800
494,300
5105,000
6165,000
7241,000
8276,000
9239,000
10182,000
11137,000
12141,000
13135,000
14112,000
1588,200
1691,300
1796,900
1894,100
1990,400
2090,800
2195,500
2297,500
2393,700
2491,800
2592,100
2690,500
2788,100
2895,900
29103,000
30121,000
31118,000
Total3,753,000
Mean121,100
Max276000
Min88100
Ac-ft7,443,000
Day Nov
2013
1119,000
2137,000
3162,000
4165,000
5157,000
6155,000
7160,000
8146,000
9136,000
10146,000
11153,000
12151,000
13146,000
14133,000
15129,000
16116,000
17119,000
18191,000
19244,000
20251,000
21241,000
22226,000
23202,000
24183,000
25171,000
26145,000
27168,000
28165,000
29193,000
30206,000
 -- 
Total5,016,000
Mean167,200
Max251000
Min116000
Ac-ft9,949,000
Day Dec
2013
1223,000
2234,000
3225,000
4196,000
5184,000
6193,000
7209,000
8248,000
9315,000
10413,000
11477,000
12514,000
13534,000
14544,000
15540,000
16520,000
17487,000
18442,000
19390,000
20347,000
21375,000
22486,000
23520,000
24586,000
25625,000
26652,000
27677,000
28694,000
29707,000
30716,000
31719,000
Total13,990,000
Mean451,400
Max719000
Min184000
Ac-ft27,750,000
Day Jan
2014
1713,000
2695,000
3674,000
4654,000
5642,000
6616,000
7564,000
8504,000
9442,000
10369,000
11363,000
12373,000
13393,000
14413,000
15453,000
16506,000
17564,000
18583,000
19591,000
20591,000
21572,000
22530,000
23417,000
24314,000
25268,000
26233,000
27209,000
28177,000
29147,000
30157,000
31174,000
Total13,900,000
Mean448,400
Max713000
Min147000
Ac-ft27,570,000
Day Feb
2014
1170,000
2163,000
3188,000
4222,000
5296,000
6427,000
7526,000
8583,000
9617,000
10638,000
11651,000
12642,000
13582,000
14448,000
15350,000
16302,000
17285,000
18298,000
19327,000
20346,000
21375,000
22417,000
23460,000
24507,000
25555,000
26583,000
27613,000
28633,000
 -- 
 -- 
 -- 
Total12,200,000
Mean435,900
Max651000
Min163000
Ac-ft24,210,000
Day Mar
2014
1647,000
2647,000
3634,000
4611,000
5581,000
6535,000
7503,000
8492,000
9480,000
10453,000
11410,000
12383,000
13335,000
14301,000
15294,000
16311,000
17343,000
18364,000
19368,000
20334,000
21285,000
22253,000
23241,000
24237,000
25231,000
26228,000
27204,000
28190,000
29183,000
30189,000
31200,000
Total11,470,000
Mean369,900
Max647000
Min183000
Ac-ft22,740,000
Day Apr
2014
1209,000
2226,000
3270,000
4353,000
5447,000
6531,000
7592,000
8627,000
9646,000
10664,000
11679,000
12691,000
13687,000
14686,000
15675,000
16641,000
17590,000
18520,000
19442,000
20376,000
21316,000
22267,000
23226,000
24190,000
25176,000
26169,000
27166,000
28211,000
29353,000
30461,000
 -- 
Total13,089,999
Mean436,200
Max691000
Min166000
Ac-ft25,960,000
Day May
2014
1501,000
2487,000
3502,000
4524,000
5530,000
6497,000
7473,000
8442,000
9379,000
10305,000
11257,000
12246,000
13248,000
14245,000
15256,000
16299,000
17336,000
18368,000
19395,000
20402,000
21412,000
22428,000
23427,000
24419,000
25397,000
26366,000
27319,000
28282,000
29244,000
30206,000
31178,000
Total11,370,000
Mean366,800
Max530000
Min178000
Ac-ft22,550,000
Day Jun
2014
1175,000
2188,000
3198,000
4173,000
5176,000
6200,000
7235,000
8247,000
9240,000
10247,000
11254,000
12268,000
13258,000
14249,000
15246,000
16253,000
17260,000
18243,000
19205,000
20167,000
21146,000
22163,000
23176,000
24183,000
25178,000
26170,000
27167,000
28168,000
29186,000
30207,000
 -- 
Total6,226,000
Mean207,500
Max268000
Min146000
Ac-ft12,350,000
Day Jul
2014
1225,000
2228,000
3203,000
4178,000
5160,000
6139,000
7132,000
8120,000
9105,000
10109,000
11113,000
12103,000
1392,900
14100,000
15115,000
16123,000
17114,000
18111,000
19101,000
20111,000
21117,000
22116,000
2394,300
2475,600
2595,300
26101,000
2780,400
28104,000
29117,000
30104,000
31106,000
Total3,794,000
Mean122,400
Max228000
Min75600
Ac-ft7,524,000
Day Aug
2014
1115,000
2104,000
390,800
481,000
585,700
6103,000
7110,000
8114,000
994,600
1090,500
1195,300
1285,200
13104,000
14117,000
15138,000
16148,000
17143,000
18143,000
19141,000
20135,000
21141,000
22146,000
23160,000
24183,000
25183,000
26182,000
27184,000
28177,000
29128,000
30129,000
31126,000
Total3,977,000
Mean128,300
Max184000
Min81000
Ac-ft7,887,999
Day Sep
2014
1103,000
2108,000
3137,000
4135,000
5120,000
6126,000
7130,000
8130,000
9130,000
10133,000
11124,000
12113,000
13121,000
14106,000
15116,000
16127,000
17113,000
1888,900
1980,800
2096,100
2186,100
2255,000
2388,500
2499,800
2578,500
2664,900
2773,300
2881,100
2980,800
3085,400
 -- 
Total3,131,000
Mean104,400
Max137000
Min55000
Ac-ft6,211,000
STATISTICS OF MONTHLY MEAN DATA FOR WATER YEARS 1928 - 2014, BY WATER YEAR (WY)
Oct Nov Dec Jan Feb Mar Apr May Jun Jul Aug Sep
Mean 109,200 171,400 304,300 401,500 462,700 516,000 449,400 351,000 220,300 154,300 122,100 105,200
Max 335,600 450,300 717,500 1,022,000 1,217,000 1,039,000 896,400 917,800 596,400 441,200 331,100 383,500
(WY) (1980) (1986) (1973) (1937) (1937) (1997) (1994) (1983) (1997) (1928) (1958) (1979)
Min 22,710 33,400 48,610 71,650 77,380 154,700 128,800 75,180 53,840 23,350 25,390 29,330
(WY) (1931) (1931) (1931) (1940) (1934) (1941) (2012) (1941) (1936) (1930) (1930) (1930)
Water-Data Report 2014
03611500 OHIO RIVER AT METROPOLIS, IL -- Continued
SUMMARY STATISTICS
Water Year 2014 Water Years 1928 - 2014
Annual total 101,900,000                   
Annual mean 279,200          279,100         
Highest annual mean           436,600          1979
Lowest annual mean           120,300          1931
Highest daily mean 719,000          Dec 31 1,850,000          Feb 01, 1937
Lowest daily mean 55,000          Sep 22 15,000          Jul 20, 1930
Annual 7-day minimum 77,300          Sep 22 16,570          Jul 20, 1930
Maximum peak flow 719,000a,b         Dec 31 1,850,000a,b         Feb 01, 1937
Maximum peak stage 44.54c      Apr 12 61.71       May 05, 2011
Annual runoff (cfsm) 1.38       1.38      
Annual runoff (inches) 18.7        18.7       
10 percent exceeds 587,600          635,000         
50 percent exceeds 207,000          195,000         
90 percent exceeds 95,740          68,800         
a Discharge is a Maximum Daily Average
b Discharge affected to unknown degree by Regulation or Diversion
c Max gage height not associated with peak discharge
USGS Water-data graph for site USGS 03611500