LOCATION.--Lat 43°06'31.2", long
73°25'20.7" referenced to North American Datum of
1983, Washington County, NY, Hydrologic Unit 02020003, on right
bank downstream from bridge on County Highway 61, 1.8 mi
downstream from Whitaker Brook, and 2.0 mi upstream from Trout
Brook, at Battenville.
DRAINAGE AREA.--396 mi².
PERIOD OF RECORD.--Occasional miscellaneous discharge
measurements, 1908-10, September to December 1908 (gage heights
only), October 1922 to September 1968, annual maximum
only--1987-98, April 1998 to current year. October 1922 to
October 2003, published as "Batten Kill at
Battenville" (01329500).
GAGE.--Water-stage recorder and crest-stage gage. Datum
of gage is 373.10 ft above NGVD of 1929 and 372.62 ft above
NAVD of 1988. Prior to October 1922, nonrecording gages at site
0.25 mi upstream at different datum. October 1922 to Oct. 10,
2003, at site 0.75 mi downstream at datum 4.01 ft lower.
REMARKS.--Regulation at low and medium flows prior to
1982.
Water Years 2014-23: Records good except those for estimated
daily discharges, which are poor.
EXTREMES FOR PERIOD OF RECORD.--Maximum discharge,
21,300 ft³/s, Nov. 4, 1927, gage height, 17.7 ft, from
floodmarks, site and datum then in use; minimum discharge, 7.3
ft³/s, Oct. 5, 1953 (result of regulation).

 Site Information
 WaterAlert – get an
email or text (SMS) alert based on your chosen threshold.
WaterAlert – get an
email or text (SMS) alert based on your chosen threshold.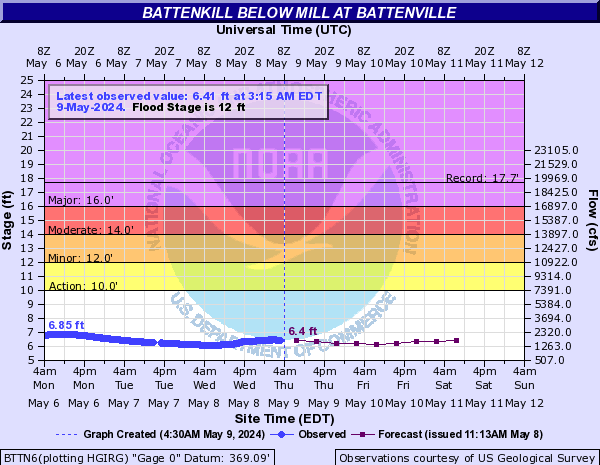
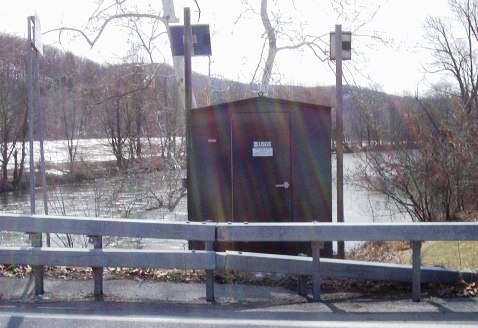 Station image