LOCATION.--Lat 41°52'45.6", long
74°08'43.3" referenced to North American Datum of
1983, Ulster County, NY, Hydrologic Unit 02020006, on right
bank at downstream side of abandoned bridge abutment upstream
from Hurley Mountain Road, 5.6 mi downstream from Ashokan
Reservoir, 1.2 mi southwest of Lomontville.
DRAINAGE AREA.--279 mi².
PERIOD OF RECORD.--November 2013 to current year.
GAGE.--Water-stage recorder and crest-stage gage. Datum
of gage is 191.93 ft above NGVD of 1929 (Federal Emergency
Management Agency flood-insurance study reference mark) and
190.96 ft above NAVD of 1988.
REMARKS.--Flow from 256 mi² of drainage area regulated
by Ashokan Reservoir since Sept. 9, 1913. Water diverted from
Schoharie Creek through Shandaken Tunnel (station 01362230)
since Feb. 3, 1924, enters Esopus Creek about 12.2 mi upstream
from Ashokan Reservoir. Diversions for water supply of City of
New York made from Ashokan Reservoir (station 01363400).
Water Years 2014-23: Records fair except those for estimated
daily discharges, which are poor.
EXTREMES FOR PERIOD OF RECORD.--Maximum discharge, 6,770
ft³/s, May 2, 2020, gage height, 9.24 ft; minimum
discharge, 2.4 ft³/s, Oct. 3, 4, 2014, gage height, 2.01
ft.
EXTREMES OUTSIDE PERIOD OF RECORD.--Flood of Apr. 3,
2005, reached a stage of 16.68 ft, from floodmark on left bank
30 ft downstream from gage.
PERIOD OF DAILY RECORD1.--SUSPENDED-SEDIMENT
DISCHARGE: November 2013 to current year.
REMARKS1.--Turbidity data are collected every
15 minutes using an in-situ turbidity probe located in a 2 inch
pipe about 100 ft across stream on left bank in a separate gage
shelter. Daily suspended-sediment load and concentration are
derived from a regression equation relating turbidity to
suspended-sediment concentration.
EXTREMES FOR PERIOD OF DAILY
RECORD1.--SUSPENDED-SEDIMENT CONCENTRATION:
Maximum daily mean, about 210 mg/L, Mar. 30, 2014; minimum
daily mean, <1 mg/L, on many days during 2014-15 water
years.
SUSPENDED-SEDIMENT DISCHARGE: Maximum daily, 770 tons, Sept.
30, 2015; minimum daily, about 0.01 ton, Oct. 3, 2014, May 30,
2015.
1 Water-Quality Records

 Site Information
 WaterAlert – get an
email or text (SMS) alert based on your chosen threshold.
WaterAlert – get an
email or text (SMS) alert based on your chosen threshold.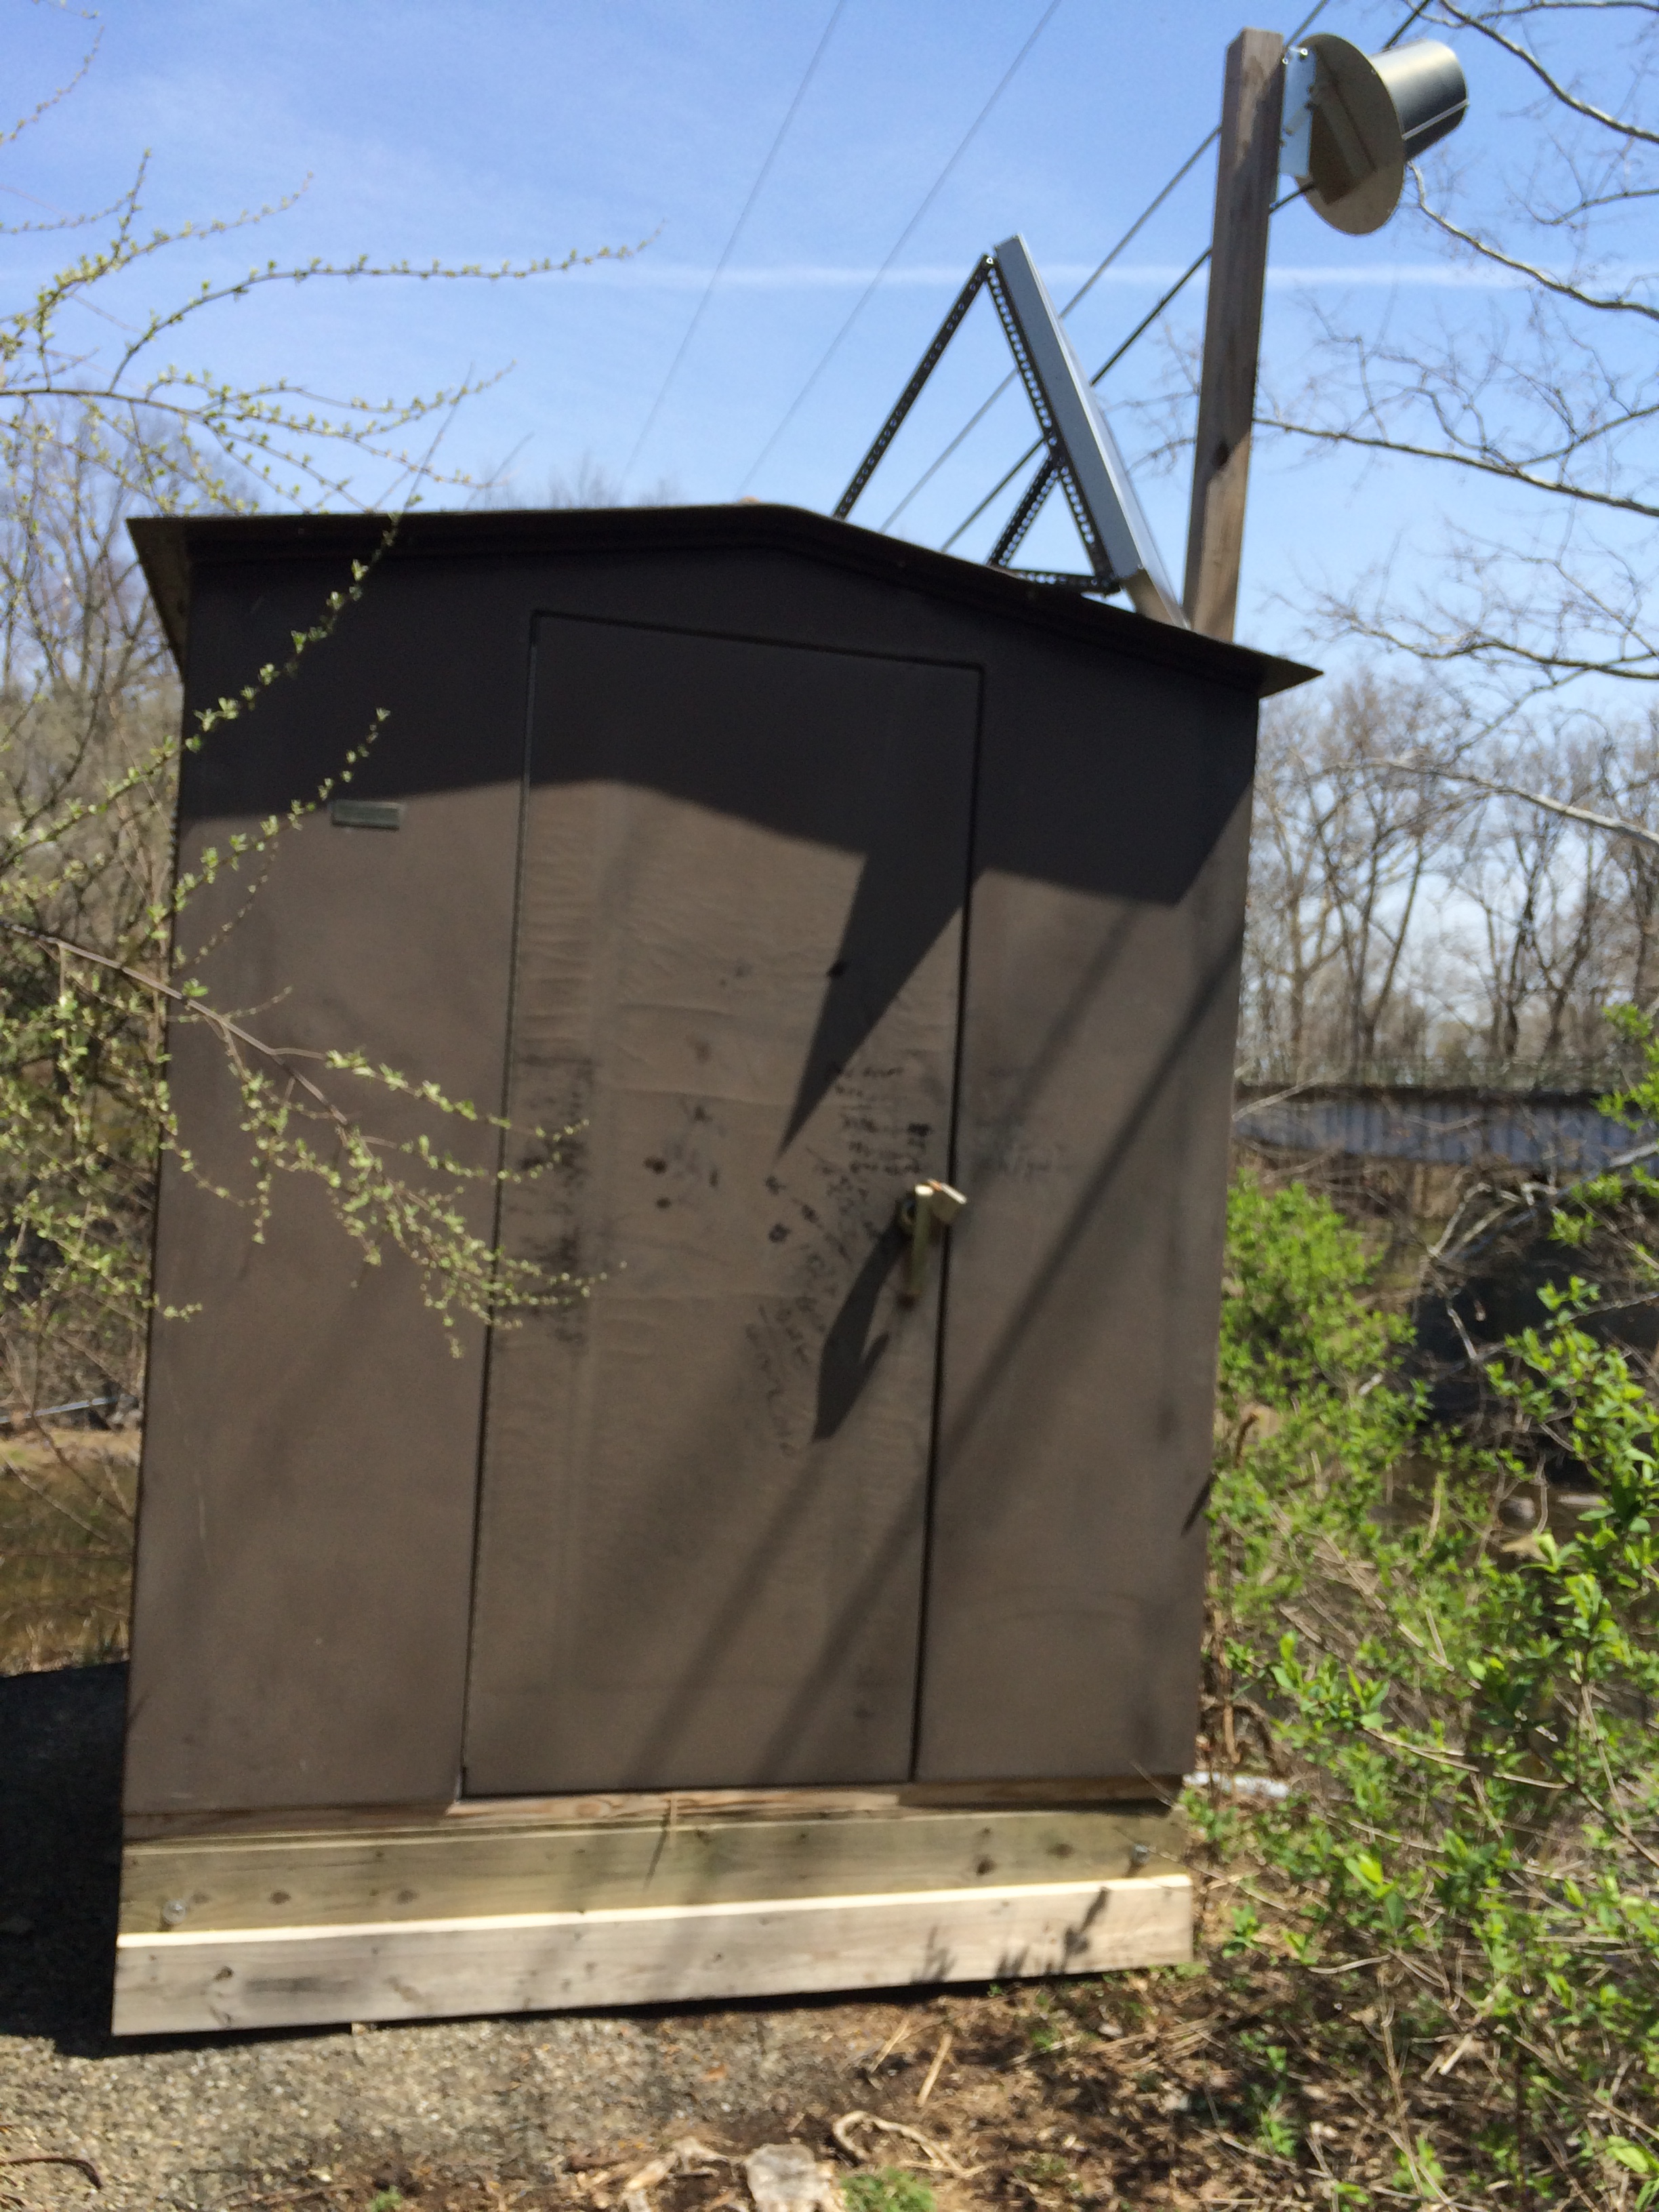 Station image