LOCATION.--Lat 42°02'08.0", long
75°48'08.2" referenced to North American Datum of
1983, Broome County, NY, Hydrologic Unit 02050101, on left bank
at abutment of former highway bridge, 500 ft upstream from
bridge on County Highway 20 at Conklin, 0.7 mi downstream
from Little Snake Creek, and 3.5 mi downstream from
Pennsylvania-New York State line.
DRAINAGE AREA.--2,232 mi².
PERIOD OF RECORD.--November 1912 to current year.
REVISIONS HISTORY.--WSP 1672: 1918 (P). WSP 2103:
Drainage area. WDR NY-81-3: 1918 (P).
GAGE.--Water-stage recorder. Datum of gage is 841.04 ft
above NGVD of 1929 (levels by Corps of Engineers) and 840.36
above NAVD of 1988. Prior to Oct. 4, 1914, nonrecording gage at
same site and datum.
REMARKS.--Minor regulation by upstream lakes and
reservoirs.
Water Years 2014-18: Records good except those for estimated
daily discharges, which are fair. Water Years 2019-23: Records
good except those for estimated daily discharges, which are
poor.
EXTREMES FOR PERIOD OF RECORD.--Maximum discharge,
76,800 ft³/s, June 28, 2006, gage height, 25.02 ft; minimum
discharge, 85 ft³/s, Oct. 14, 1964, gage height 1.30 ft.
PERIOD OF DAILY RECORD1.-- WATER TEMPERATURE:
May 2012 to June 2014. SPECIFIC CONDUCTANCE: May 2012 to June
2014.
EXTREMES FOR PERIOD OF DAILY RECORD1.--
WATER TEMPERATURE: Maximum, 24.3°C, July 19, 2013; minimum,
0.0°C, on many days during winter period.
SPECIFIC CONDUCTANCE: Maximum, 361 uS/cm @ 25°C, July 21, 2013,
and Aug. 25, 2013; minimum, 127 uS/cm @ 25°C, June 29,
2013.
1 Water-Quality Records

 Site Information
 WaterAlert – get an
email or text (SMS) alert based on your chosen threshold.
WaterAlert – get an
email or text (SMS) alert based on your chosen threshold.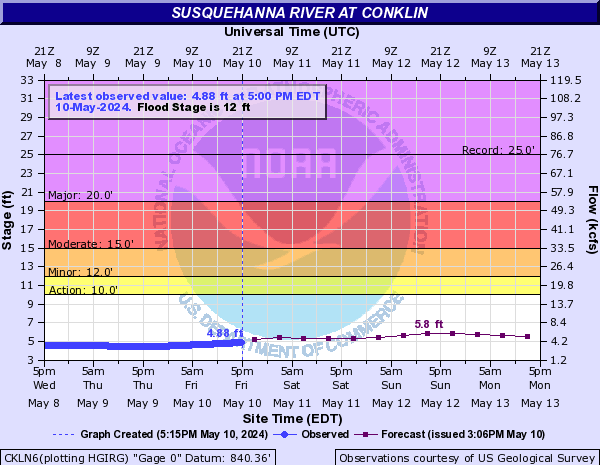
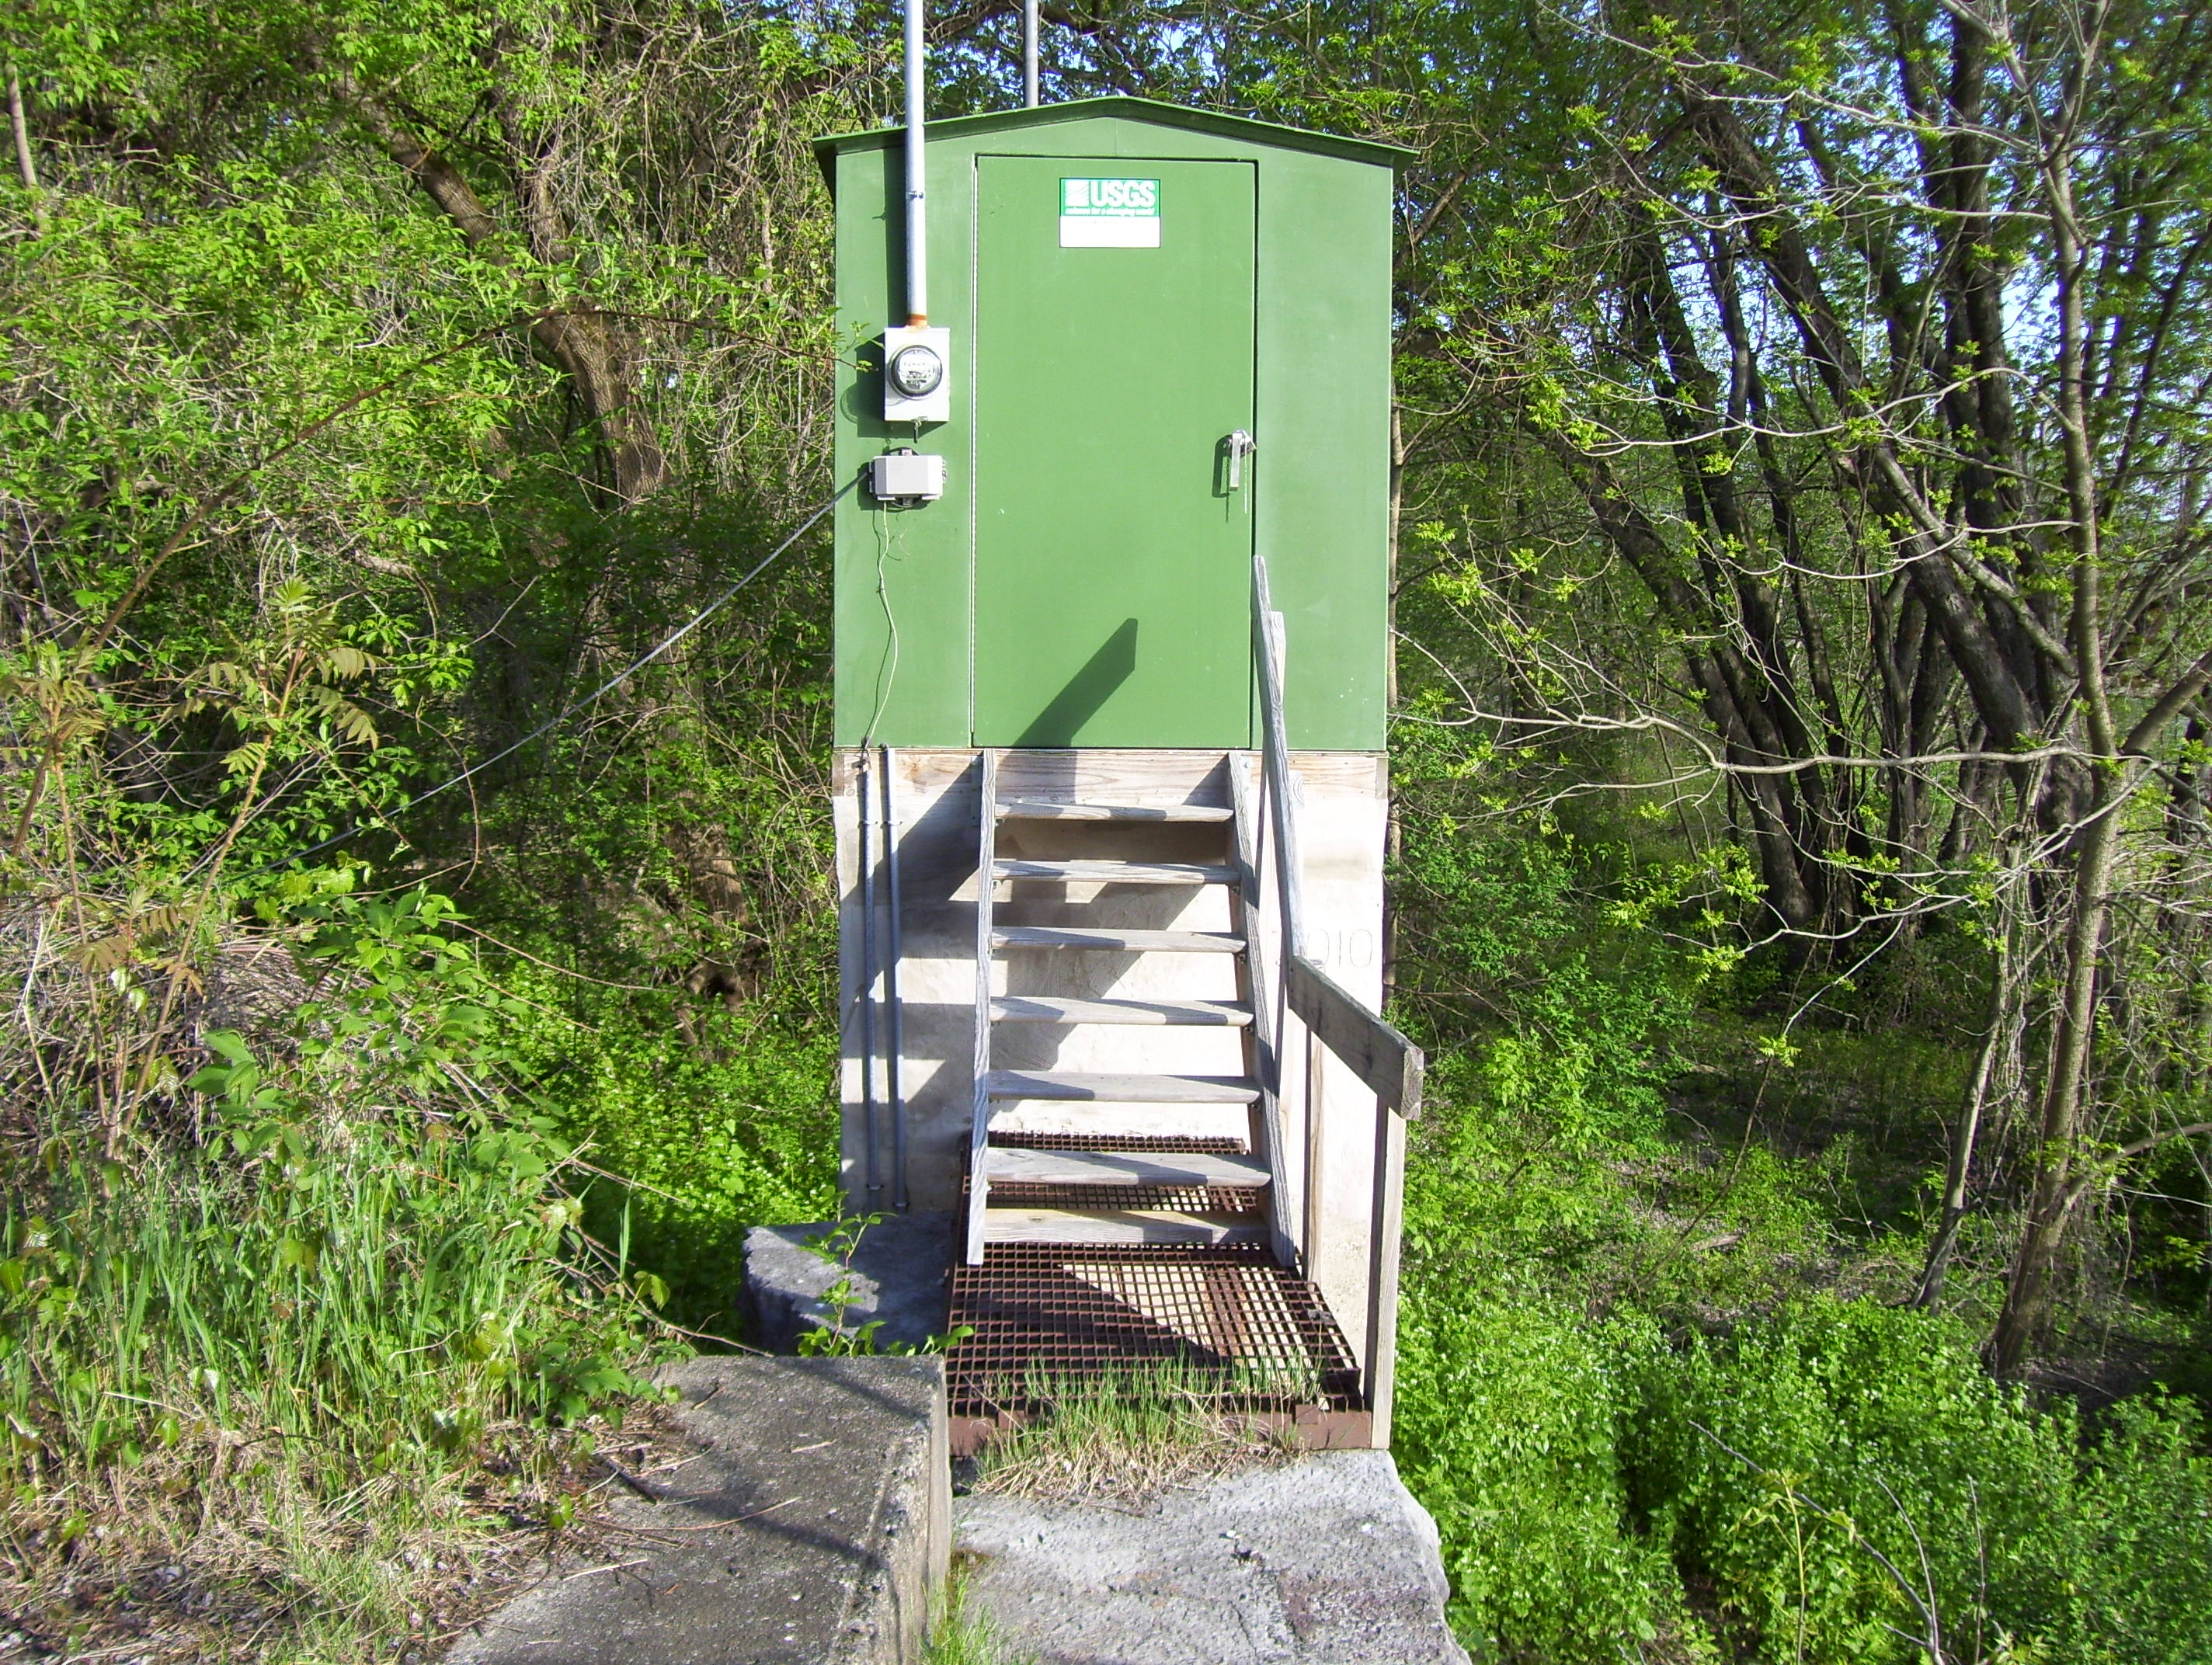 Station image