LOCATION.--Lat 44°59'58.6", long
73°30'07.5" referenced to North American Datum of
1983, Clinton County, NY, Hydrologic Unit 04150408, on left
bank 500 ft upstream from bridge on Creek Road at Perry Mills,
and 7.5 mi upstream from Corbeau Creek.
DRAINAGE AREA.--243 mi².
PERIOD OF RECORD.--September 1928 to September 1968,
annual maximum only--1985, 1987-89, March 1990 to current
year.
GAGE.--Water-stage recorder and crest-stage gage. Datum
of gage is 164.93 ft above NGVD of 1929 and 164.44 ft above
NAVD of 1988.
REMARKS.--At flows greater than about 2,000 ft³/s,
significant undetermined amounts of flow bypass the gage.
Records prior to October 1968 affected by diurnal fluctuation
at low and medium flow by sawmill immediately upstream.
Occasional regulation by Chazy Lake (usable capacity, about 765
mil ft³) and from which the Clinton Correctional Facility at
Dannemora (Saranac River basin) obtains its water supply (about
1 ft³/s).
Water Years 2014-22: Records good except those for estimated
daily discharges, which are poor.
EXTREMES FOR PERIOD OF RECORD.--Maximum discharge, 9,700
ft³/s, Nov. 9, 1996, gage height, 12.24 ft; maximum gage
height, 12.91 ft, Feb. 28, 2000 (ice jam), from floodmark in
gage house; minimum discharge, about 0.8 ft³/s, Sept. 18, 1932;
minimum gage height, 1.22 ft, Sept. 6, 14, 1999.

 Site Information
 WaterAlert – get an
email or text (SMS) alert based on your chosen threshold.
WaterAlert – get an
email or text (SMS) alert based on your chosen threshold.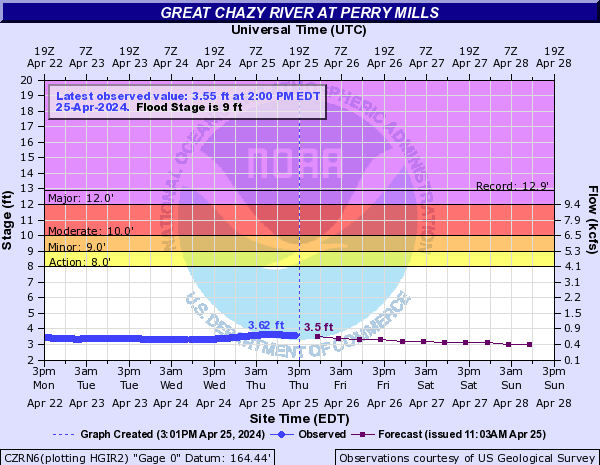
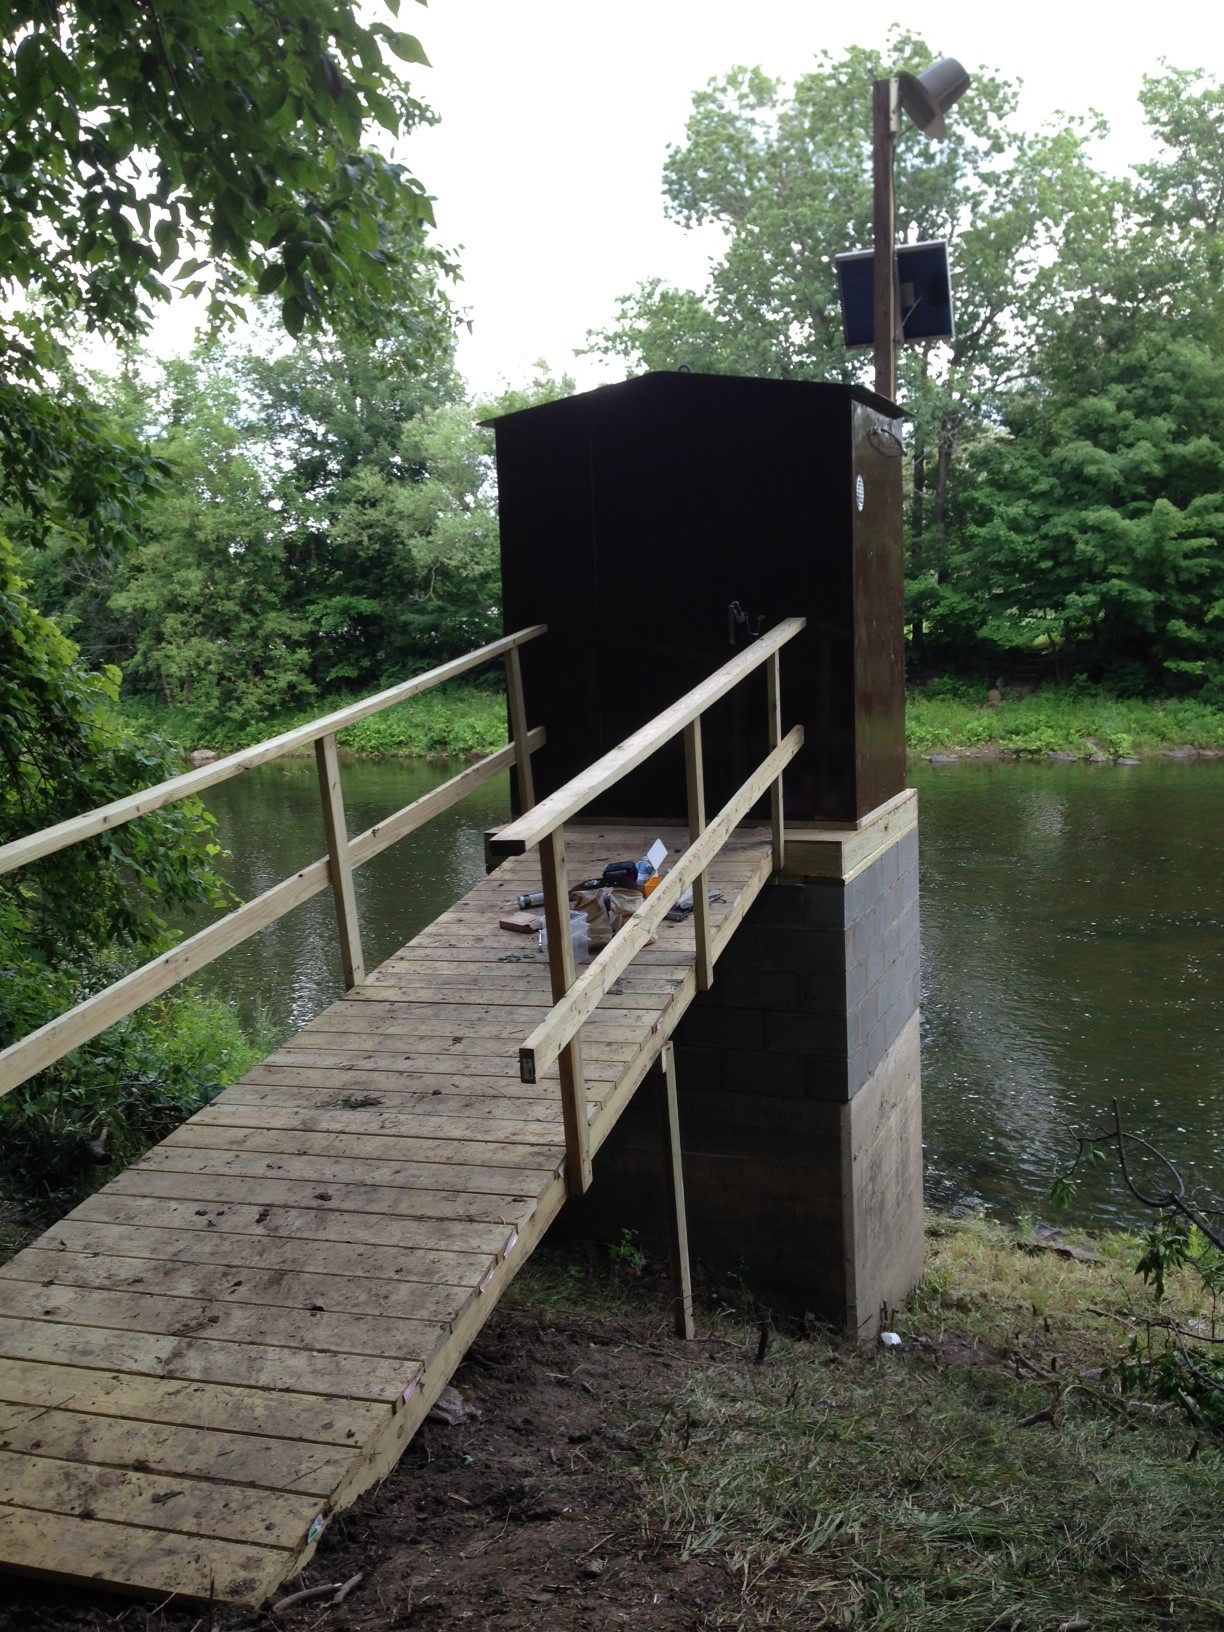 Station image