LOCATION.--Lat 42°00'40", long
74°24'52" referenced to North American Datum of 1983,
Ulster County, NY, Hydrologic Unit 02040104, on right bank 0.1
mi southwest of Winnisook Lake, and 4.5 mi northeast of Frost
Valley.
DRAINAGE AREA.--0.83 mi².
PERIOD OF RECORD.--January 1991 to March 2013, September
2019 to current year.
REVISIONS HISTORY.--WDR NY-94-1: 1992-93(P). WDR
NY-01-1: 2000.
GAGE.--Water-stage recorder and crest-stage gage. Datum
of gage is 2,675.00 ft above NAVD of 1988.
REMARKS.--Water Years 2019-23: Records fair except those
below 1.0 ft³/s and those for estimated daily discharges, which
are poor.
EXTREMES FOR PERIOD OF RECORD.--Maximum discharge, 344
ft³/s, Aug. 28, 2011, gage height, 4.76 ft, from rating curve
extended above 65 ft³/s on basis of runoff comparisons with
nearby stations; minimum discharge, 0.02 ft³/s, Feb. 26, 27,
2021, gage height, 1.16 ft; minimum gage height, 0.93 ft, Aug.
6, 7, 8, 1991.
PERIOD OF DAILY RECORD1.--WATER TEMPERATURE:
September 2019 to current year. SPECIFIC CONDUCTANCE: September
2019 to current year.
INSTRUMENTATION1.--A continuous water-quality
monitor with water temperature and specific conductance
provides 15-minute-interval readings.
EXTREMES FOR PERIOD OF DAILY RECORD1.--WATER
TEMPERATURE: Maximum, 16.4 °C, Aug. 8, 2022; minimum, -0.1 °C,
Jan. 3, Feb. 18, 2022. SPECIFIC CONDUCTANCE: Maximum, 24 uS/cm
at 25 °C, Oct. 26, 2021, Feb. 18, 2022; minimum, 9
uS/cm at 25 °C, May 24, 2020.
1 Water-Quality Records

 Site Information
 WaterAlert – get an
email or text (SMS) alert based on your chosen threshold.
WaterAlert – get an
email or text (SMS) alert based on your chosen threshold.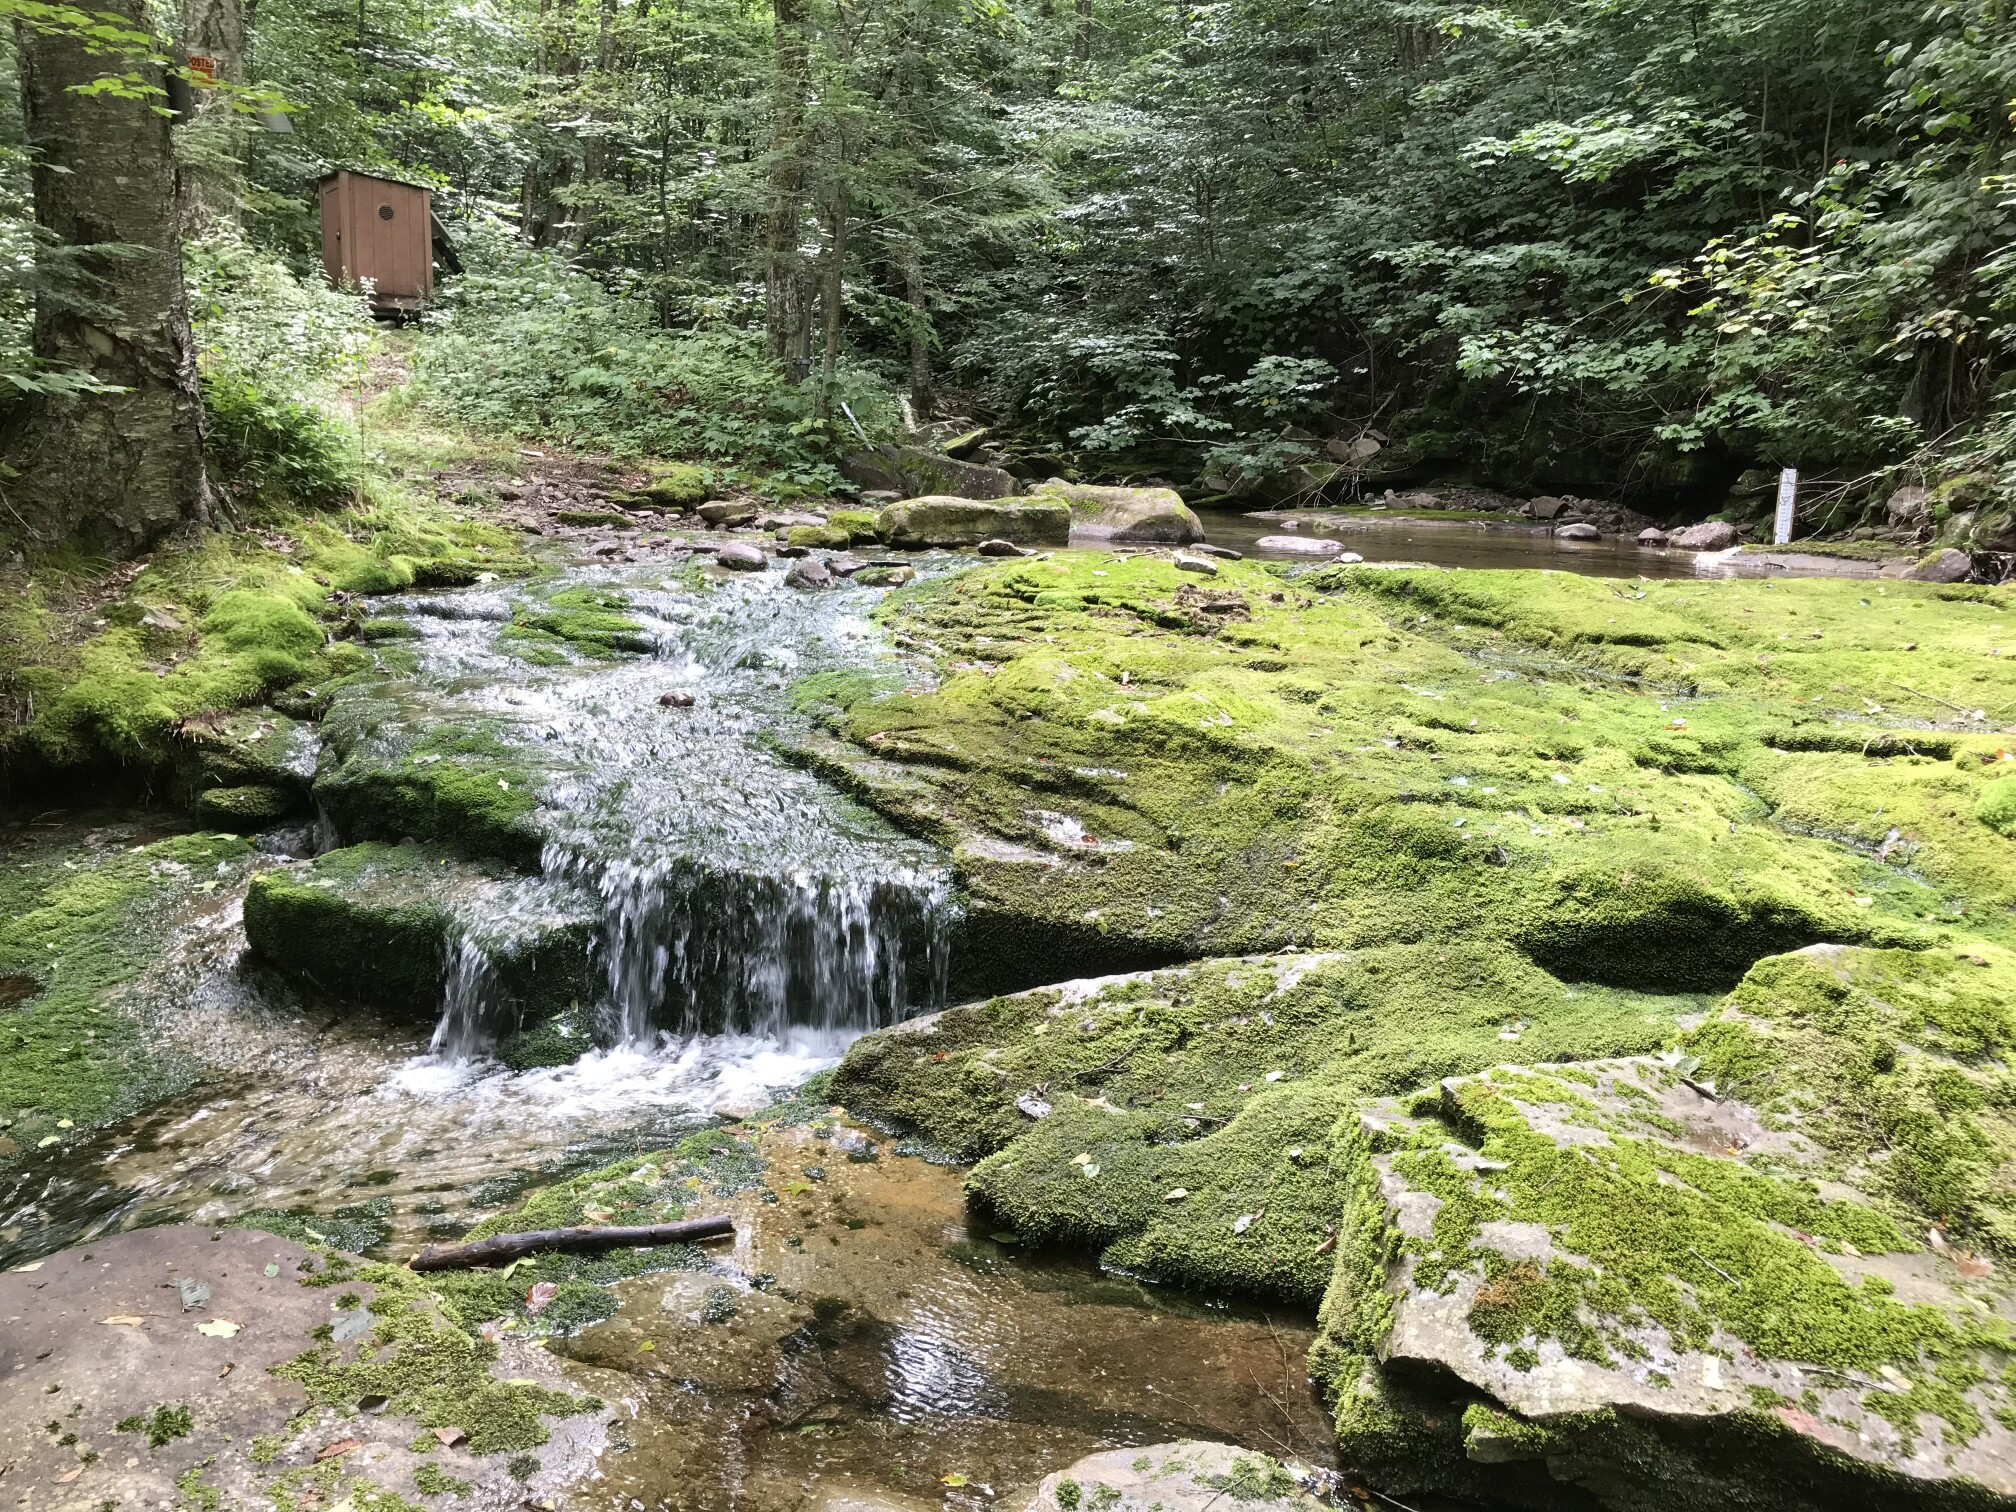 Station image

