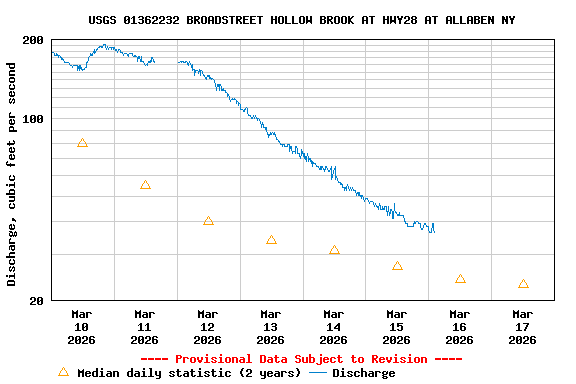
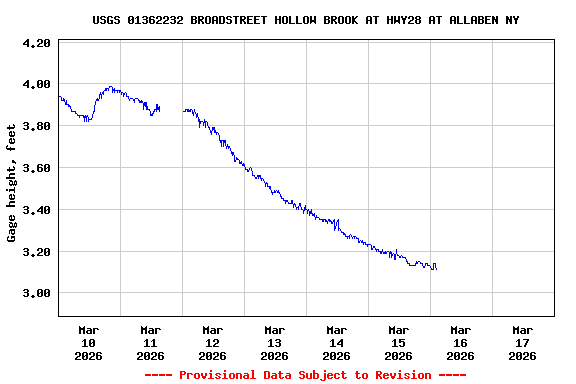
PROVISIONAL DATA SUBJECT TO REVISION
Click to hidestation-specific text
Funding for this site is provided by:
 Site Information
LOCATION.--Lat 42°06'45.2", long
74°21'31.3" referenced to North American Datum of
1983, Ulster County, NY, Hydrologic Unit 02020006, on left bank
at downstream side of bridge on State Highway 28, at
Allaben.
DRAINAGE AREA.--9.16 mi².
PERIOD OF RECORD.--Miscellaneous measurements--2010-11. August 2022 to current year.
GAGE.--Water-stage recorder and crest-stage gage. Elevation of gage is 980 ft above NAVD of 1988, from topographic map. Prior to August 2022, at different datum.
REMARKS.--Water Years 2022-24: Records fair except those for estimated daily discharges, which are poor.
EXTREMES FOR PERIOD OF RECORD.--Maximum discharge, 1,320 ft³/s, Dec. 18, 2023, gage height, 6.15 ft; minimum discharge, 1.19 ft³/s, Nov. 6, 2024, gage height, 2.41 ft; minimum gage height, 2.03 ft, Aug. 17, 2022.
 WaterAlert – get an
email or text (SMS) alert based on your chosen threshold.
WaterAlert – get an
email or text (SMS) alert based on your chosen threshold. Station image
Summary of all available data for this site
Instantaneous-data availability statement