PROVISIONAL DATA SUBJECT TO REVISION
Click to hidestation-specific text
 Site Information
LOCATION.--Lat 42°21'20.6", long
74°26'39.4" referenced to North American Datum of
1983, Schoharie County, NY, Hydrologic Unit 02020005, in
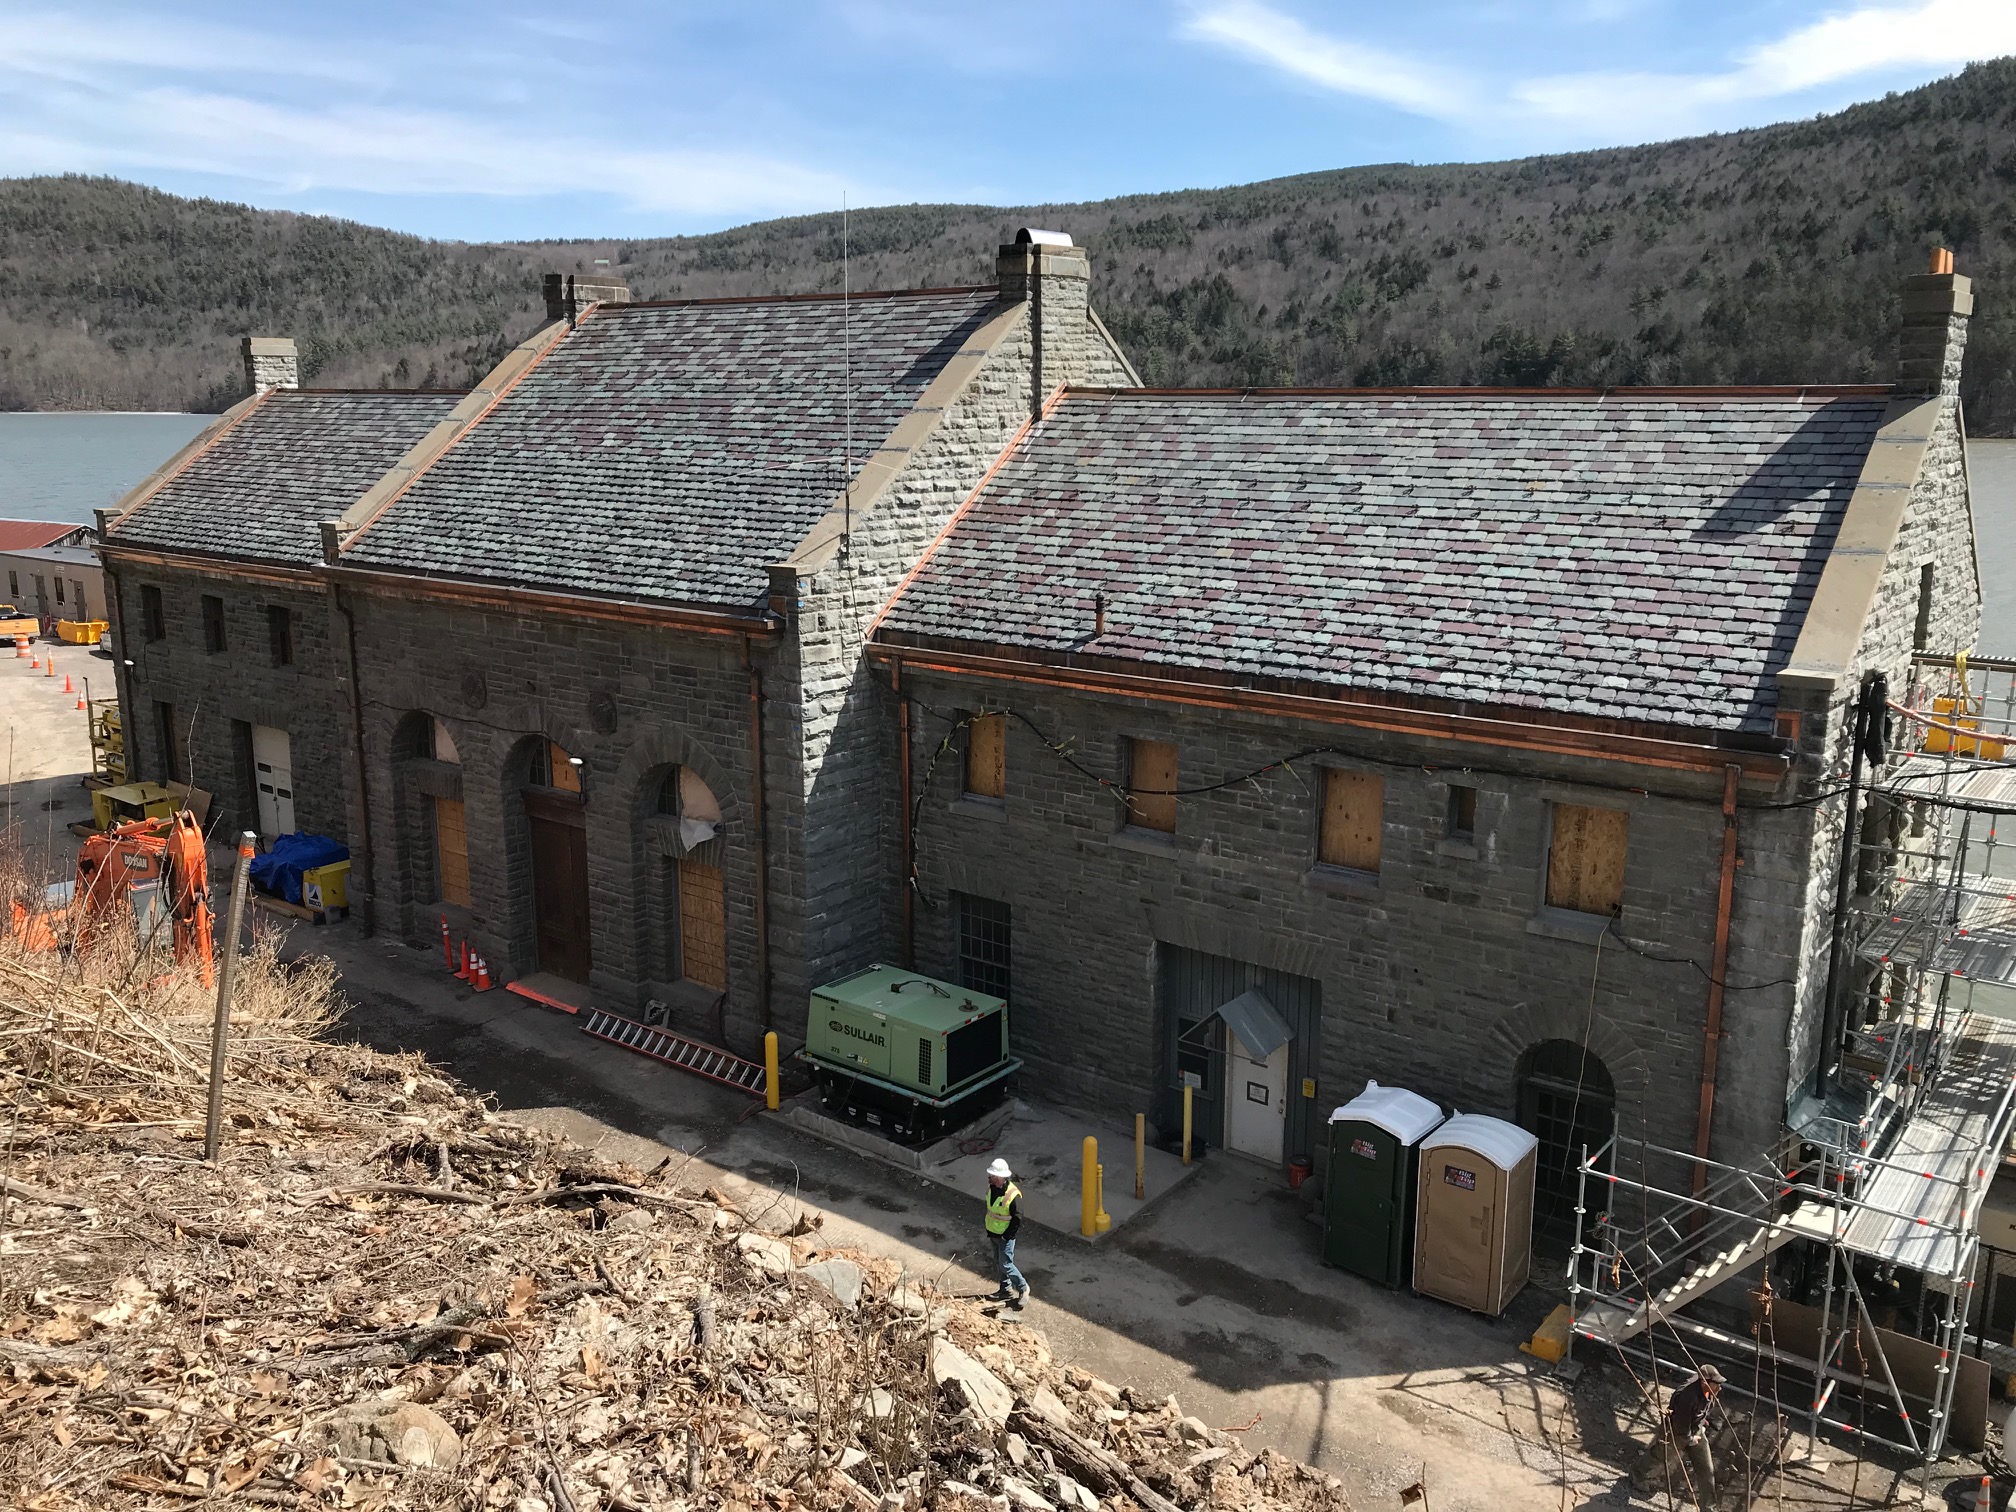
Shandaken Tunnel intake house on Intake Road, 1.6 mi north of
junction of Intake Road and State Highway 23, 2.5 mi upstream
from Gilboa Dam, and 2.6 mi east of Grand Gorge.
DRAINAGE AREA.--315 mi².
PERIOD OF RECORD.--January 1973 to current year. Monthly contents only published as "at Gilboa" for September 1928 to December 1972.
REVISIONS HISTORY.--WDR NY-86-1: 1956 (maximum elevation). WDR NY-90-1: Drainage area.
GAGE.--Water-stage recorder. Supplementary nonrecording gage used for periods when reservoir elevation is below 1,065.00 ft. Prior to November 2001, supplementary nonrecording gage used for periods when reservoir elevation was below 1,072.50 ft. Datum of gage is NGVD of 1929 (levels by Board of Water Supply, City of New York). To convert elevations to NAVD of 1988, subtract 0.60 ft (VERTCON).
COOPERATION.--Capacity table and once-daily nonrecording gage readings provided by Department of Environmental Protection, City of New York.
REMARKS.--Reservoir is formed by masonry and earth dam. Storage began July 24, 1926. Usable capacity 19,583 mil gal between minimum operating level, elevation 1,050.00 ft, and crest of spillway, elevation 1,130.00 ft. Dead storage below elevation 1,050.00 ft, 1,968 mil gal. Figures given herein represent usable contents. A 220 ft-wide notch was cut into the 1,324 ft-wide spillway in February 2006, elevation of the crest of the notch 1,124.5 ft, and four 4 ft-diameter siphons were installed on the dam in March 2006. The construction of the notch and siphons are part of a dam and spillway reconstruction and modification project. Additional information on modifications that have taken place since 2006 and a project description and schedule can be accessed at https://www.nyc.gov/html/dep/html/press_releases/11-47pr.shtml#.ZD1f8uYpAuV. Reservoir impounds water except for periods of spilling, for diversion through Shandaken Tunnel into Esopus Creek to Ashokan Reservoir, for New York City water supply.
EXTREMES FOR PERIOD OF RECORD.--Maximum elevation, 1,137.73 ft, Aug. 28, 2011, contents, 22,679 mil gal; minimum elevation observed (after initial filling), 1,062.00 ft, Aug. 20, 1970, contents, 1,520 mil gal.
DRAINAGE AREA.--315 mi².
PERIOD OF RECORD.--January 1973 to current year. Monthly contents only published as "at Gilboa" for September 1928 to December 1972.
REVISIONS HISTORY.--WDR NY-86-1: 1956 (maximum elevation). WDR NY-90-1: Drainage area.
GAGE.--Water-stage recorder. Supplementary nonrecording gage used for periods when reservoir elevation is below 1,065.00 ft. Prior to November 2001, supplementary nonrecording gage used for periods when reservoir elevation was below 1,072.50 ft. Datum of gage is NGVD of 1929 (levels by Board of Water Supply, City of New York). To convert elevations to NAVD of 1988, subtract 0.60 ft (VERTCON).
COOPERATION.--Capacity table and once-daily nonrecording gage readings provided by Department of Environmental Protection, City of New York.
REMARKS.--Reservoir is formed by masonry and earth dam. Storage began July 24, 1926. Usable capacity 19,583 mil gal between minimum operating level, elevation 1,050.00 ft, and crest of spillway, elevation 1,130.00 ft. Dead storage below elevation 1,050.00 ft, 1,968 mil gal. Figures given herein represent usable contents. A 220 ft-wide notch was cut into the 1,324 ft-wide spillway in February 2006, elevation of the crest of the notch 1,124.5 ft, and four 4 ft-diameter siphons were installed on the dam in March 2006. The construction of the notch and siphons are part of a dam and spillway reconstruction and modification project. Additional information on modifications that have taken place since 2006 and a project description and schedule can be accessed at https://www.nyc.gov/html/dep/html/press_releases/11-47pr.shtml#.ZD1f8uYpAuV. Reservoir impounds water except for periods of spilling, for diversion through Shandaken Tunnel into Esopus Creek to Ashokan Reservoir, for New York City water supply.
Capacity table (elevation, in feet, and usable contents, in million gallons)

Elevation  Contents      Elevation  Contents
1,050.0        0         1,120.0    16,097
1,060.0    1,216         1,130.0    19,583
1,080.0    4,969         1,133.0    20,700
1,100.0   10,080         1,140.0    23,637
EXTREMES FOR PERIOD OF RECORD.--Maximum elevation, 1,137.73 ft, Aug. 28, 2011, contents, 22,679 mil gal; minimum elevation observed (after initial filling), 1,062.00 ft, Aug. 20, 1970, contents, 1,520 mil gal.
 Additional Site
Information
Peak Flow and Stage Information
NAVD 1988 Datum Conversion Information
Radar elevation may correspond to top of ice during winter periods.
Summary of all available data for this site
Instantaneous-data availability statement
 WaterAlert – get an
email or text (SMS) alert based on your chosen threshold.
 Station image
