PROVISIONAL DATA SUBJECT TO REVISION
Click to hidestation-specific text
 Site Information
LOCATION.--Lat 40°51'44.3", long
73°52'27.8" referenced to North American Datum of
1983, Bronx County, NY, Hydrologic Unit 02030102, on left bank
at New York Botanical Garden in Bronx.
DRAINAGE AREA.--38.4 mi². not including 12.7 mi², from which the entire flow is diverted for municipal water supply.
PERIOD OF RECORD.--August 2006 to current year.
GAGE.--Water-stage recorder. Datum of gage is 49.86 ft above NAVD of 1988.
REMARKS.--Entire flow, runoff from 12.7 mi², diverted from Kensico Reservoir for water supply of City of New York and entire flow, runoff from 0.68 mi², except for periods of spill, diverted from White Plains Reservoirs 1 and 2 for water supply of City of White Plains. Satellite gage-height telemeter at station.
Water Years 2014-24: Records fair.
EXTREMES FOR PERIOD OF RECORD.--Maximum discharge, 3,460 ft³/s, Apr. 16, 2007, gage height, 6.05 ft; minimum discharge, 2.7 ft³/s, Nov. 4, 2024, gage height, 0.32 ft.
PERIOD OF DAILY RECORD1.--WATER TEMPERATURE: June 2021 to current year.
SPECIFIC CONDUCTANCE: June 2021 to current year.
SALINITY: June 2021 to current year.
pH: June 2021 to current year.
DISSOLVED OXYGEN: June 2021 to current year.
TURBIDITY: June 2021 to current year.
INSTRUMENTATION1.--A continuous water-quality monitor with water temperature, specific conductance, pH, dissolved oxygen, and turbidity provides 15-minute-interval readings. Salinity record computed from specific-conductance readings.
EXTREMES FOR PERIOD OF DAILY RECORD1.--WATER TEMPERATURE: Maximum, 27.2 °C, June 30, 2021; minimum, -0.2 °C, Jan. 22, 2022, Jan. 23, 2025.
SPECIFIC CONDUCTANCE: Maximum, 7,650 uS/cm @ 25 °C, Feb. 9, 2025; minimum, 80 uS/cm @ 25 °C, Jan. 10, 2021.
SALINITY: Maximum, 4.2 psu, Feb. 9, 2025; minimum, 0.0 psu, Jan. 10, 2021.
pH: Maximum, 9.3, Mar. 14, 2025; minimum, 6.7, Sept. 2, 2021.
DISSOLVED OXYGEN: Maximum, 19.0 mg/L, Feb. 21, 2024; minimum, 0.4 mg/L, Aug. 31, 2022.
TURBIDITY: Maximum, 289 FNU, Sept. 13, 2023; minimum, <0.3 FNU, June 24, 2024. [<, actual value is known to be less than the value shown
1 Water-Quality Records
 WaterAlert – get an
email or text (SMS) alert based on your chosen threshold.
WaterAlert – get an
email or text (SMS) alert based on your chosen threshold.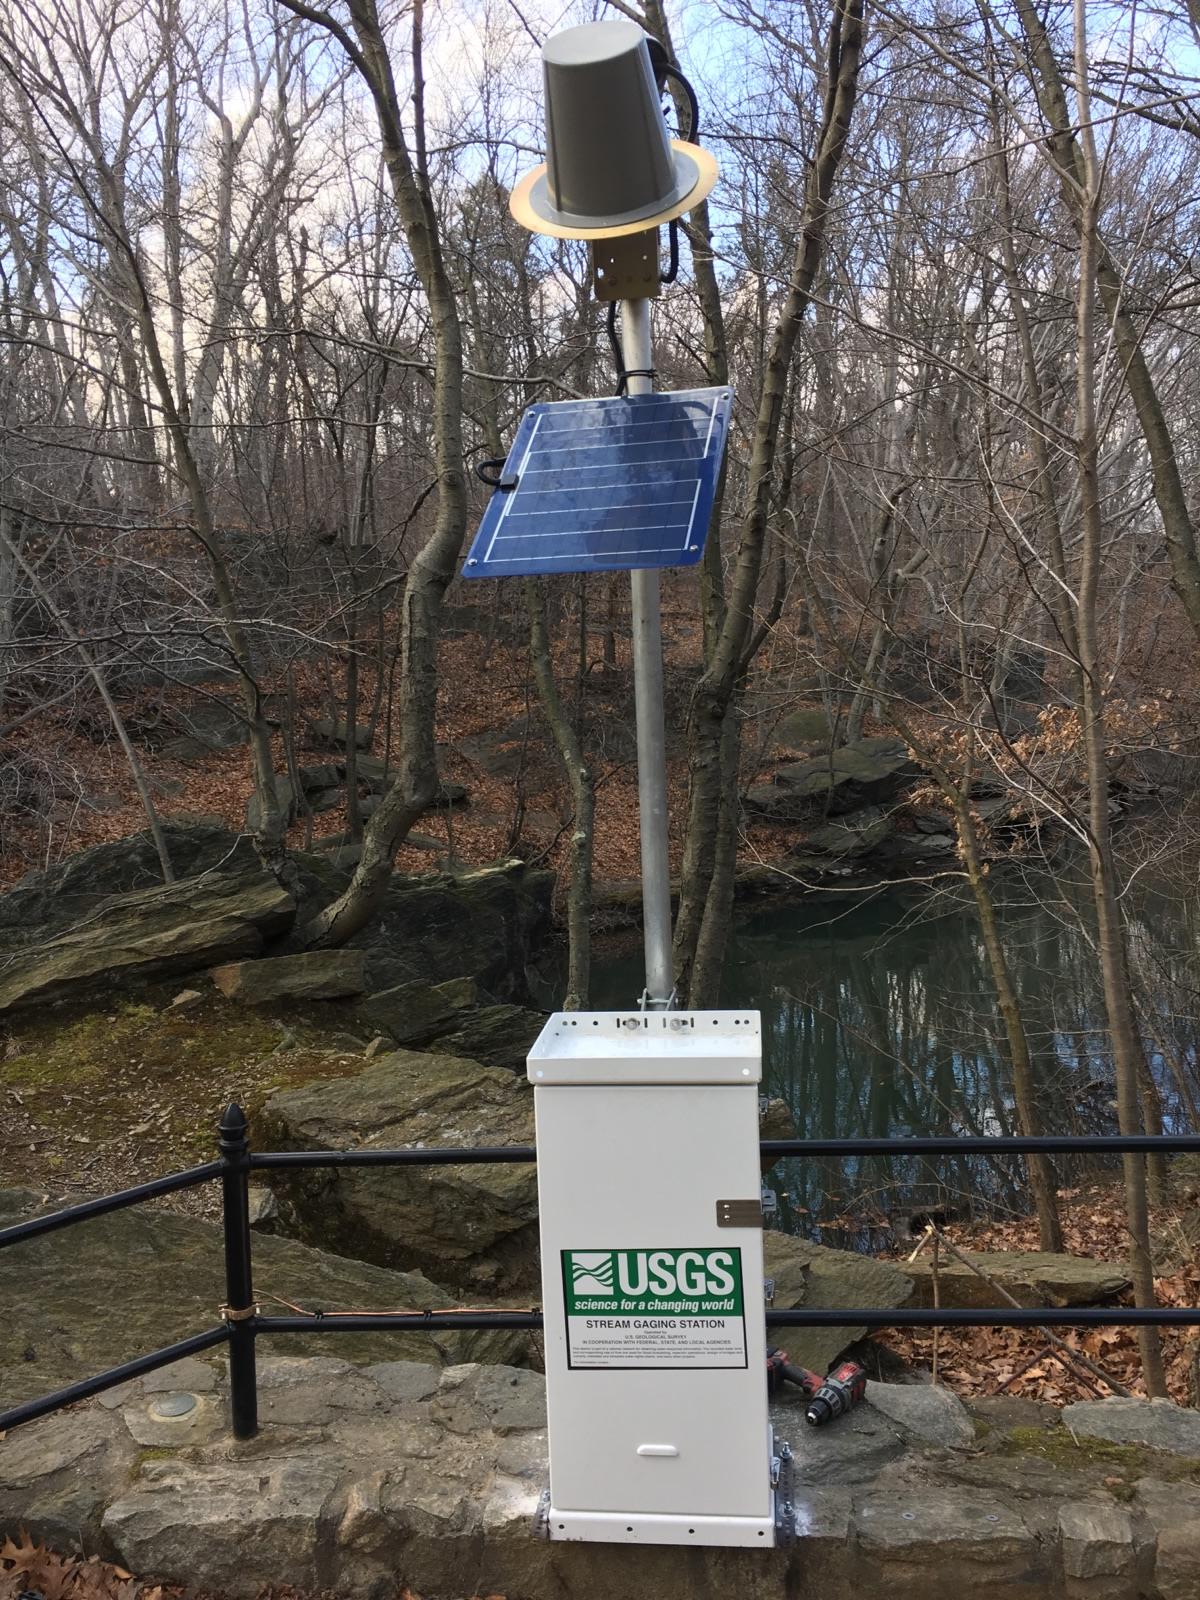 Station image
Summary of all available data for this site
Instantaneous-data availability statement


