PROVISIONAL DATA SUBJECT TO REVISION
Click to hidestation-specific text
 Site Information
LOCATION.--Lat 40°41'29.0", long
72°59'22.9" referenced to North American Datum of
1983, Suffolk County, NY, Hydrologic Unit 02030202, at National
Park Service Watch Hill Marina, on Fire Island.
PERIOD OF RECORD.--March 2016 to current year.
GAGE.--Water-stage recorder. Datum of gage is NGVD of 1929.
REMARKS.--Satellite and telephone elevation telemeters at station. Gaps in record caused by equipment malfunctions are filled with estimated data from nearby gage 01306402 Great South Bay at West Sayville NY.
EXTREMES FOR PERIOD OF RECORD.--Maximum elevation, 4.59 ft, Oct 30, 2017; minimum elevation, -1.38 ft, Jan. 6, 2018.
EXTREMES OUTSIDE PERIOD OF RECORD.--Storm tide of Oct. 30, 2012, reached an elevation of 6.7 ft, from high-water mark at site 3.7 mi northwest.
 WaterAlert – get an
email or text (SMS) alert based on your chosen threshold.
WaterAlert – get an
email or text (SMS) alert based on your chosen threshold.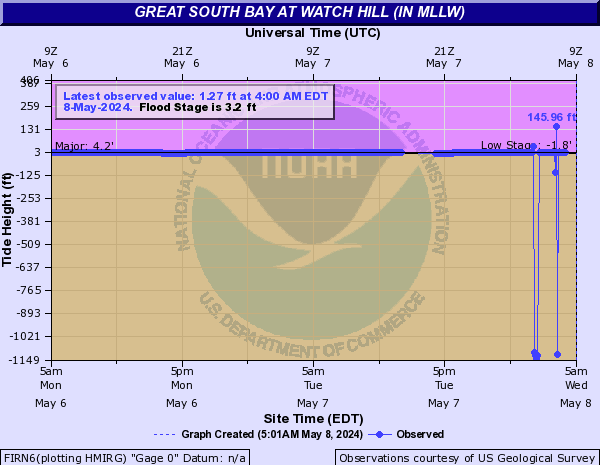 Additional Site
Information
Additional Site
Information
Peak Flow and Stage Information
NAVD 1988 Datum Conversion Information
|
Elevation observations and tidal predictions for this station are reported to NGVD 1929. To convert data to NAVD 1988 subtract 1.06 ft. To convert data to MHHW datum subtract 1.77 ft. To convert data to MLLW datum subtract 0.36 ft. These corrections vary from site to site. |
|
NGVD
1929 is the National Geodetic Vertical Datum of 1929,
formerly called "mean sea level" or "Sea
Level Datum of 1929." NGVD 1929 was a general
adjustment of the first-order level nets fit to mean sea
level at 26 tide gages in the US and Canada.
NAVD 1988 is the North American Vertical Datum of 1988, which is a geodetic datum derived from a general adjustment of the first-order level nets fit to 1 tide gage in eastern Canada. MHHW is mean higher high water, which is a site-specific datum determined by averaging the highest of the 2 high tides that occur each day over a 19-year tidal epoch. For tide gages with less than 19 years of record, this datum is estimated by correlation with long-term tide gages. MLLW is mean lower low water, which is a site-specific datum determined by averaging the lowest of the 2 low tides that occur each day over a 19-year tidal epoch. For tide gages with less than 19 years of record, this datum is estimated by correlation with long-term tide gages. |
Additional sensor graph(s) available (click on graph or sensor name)
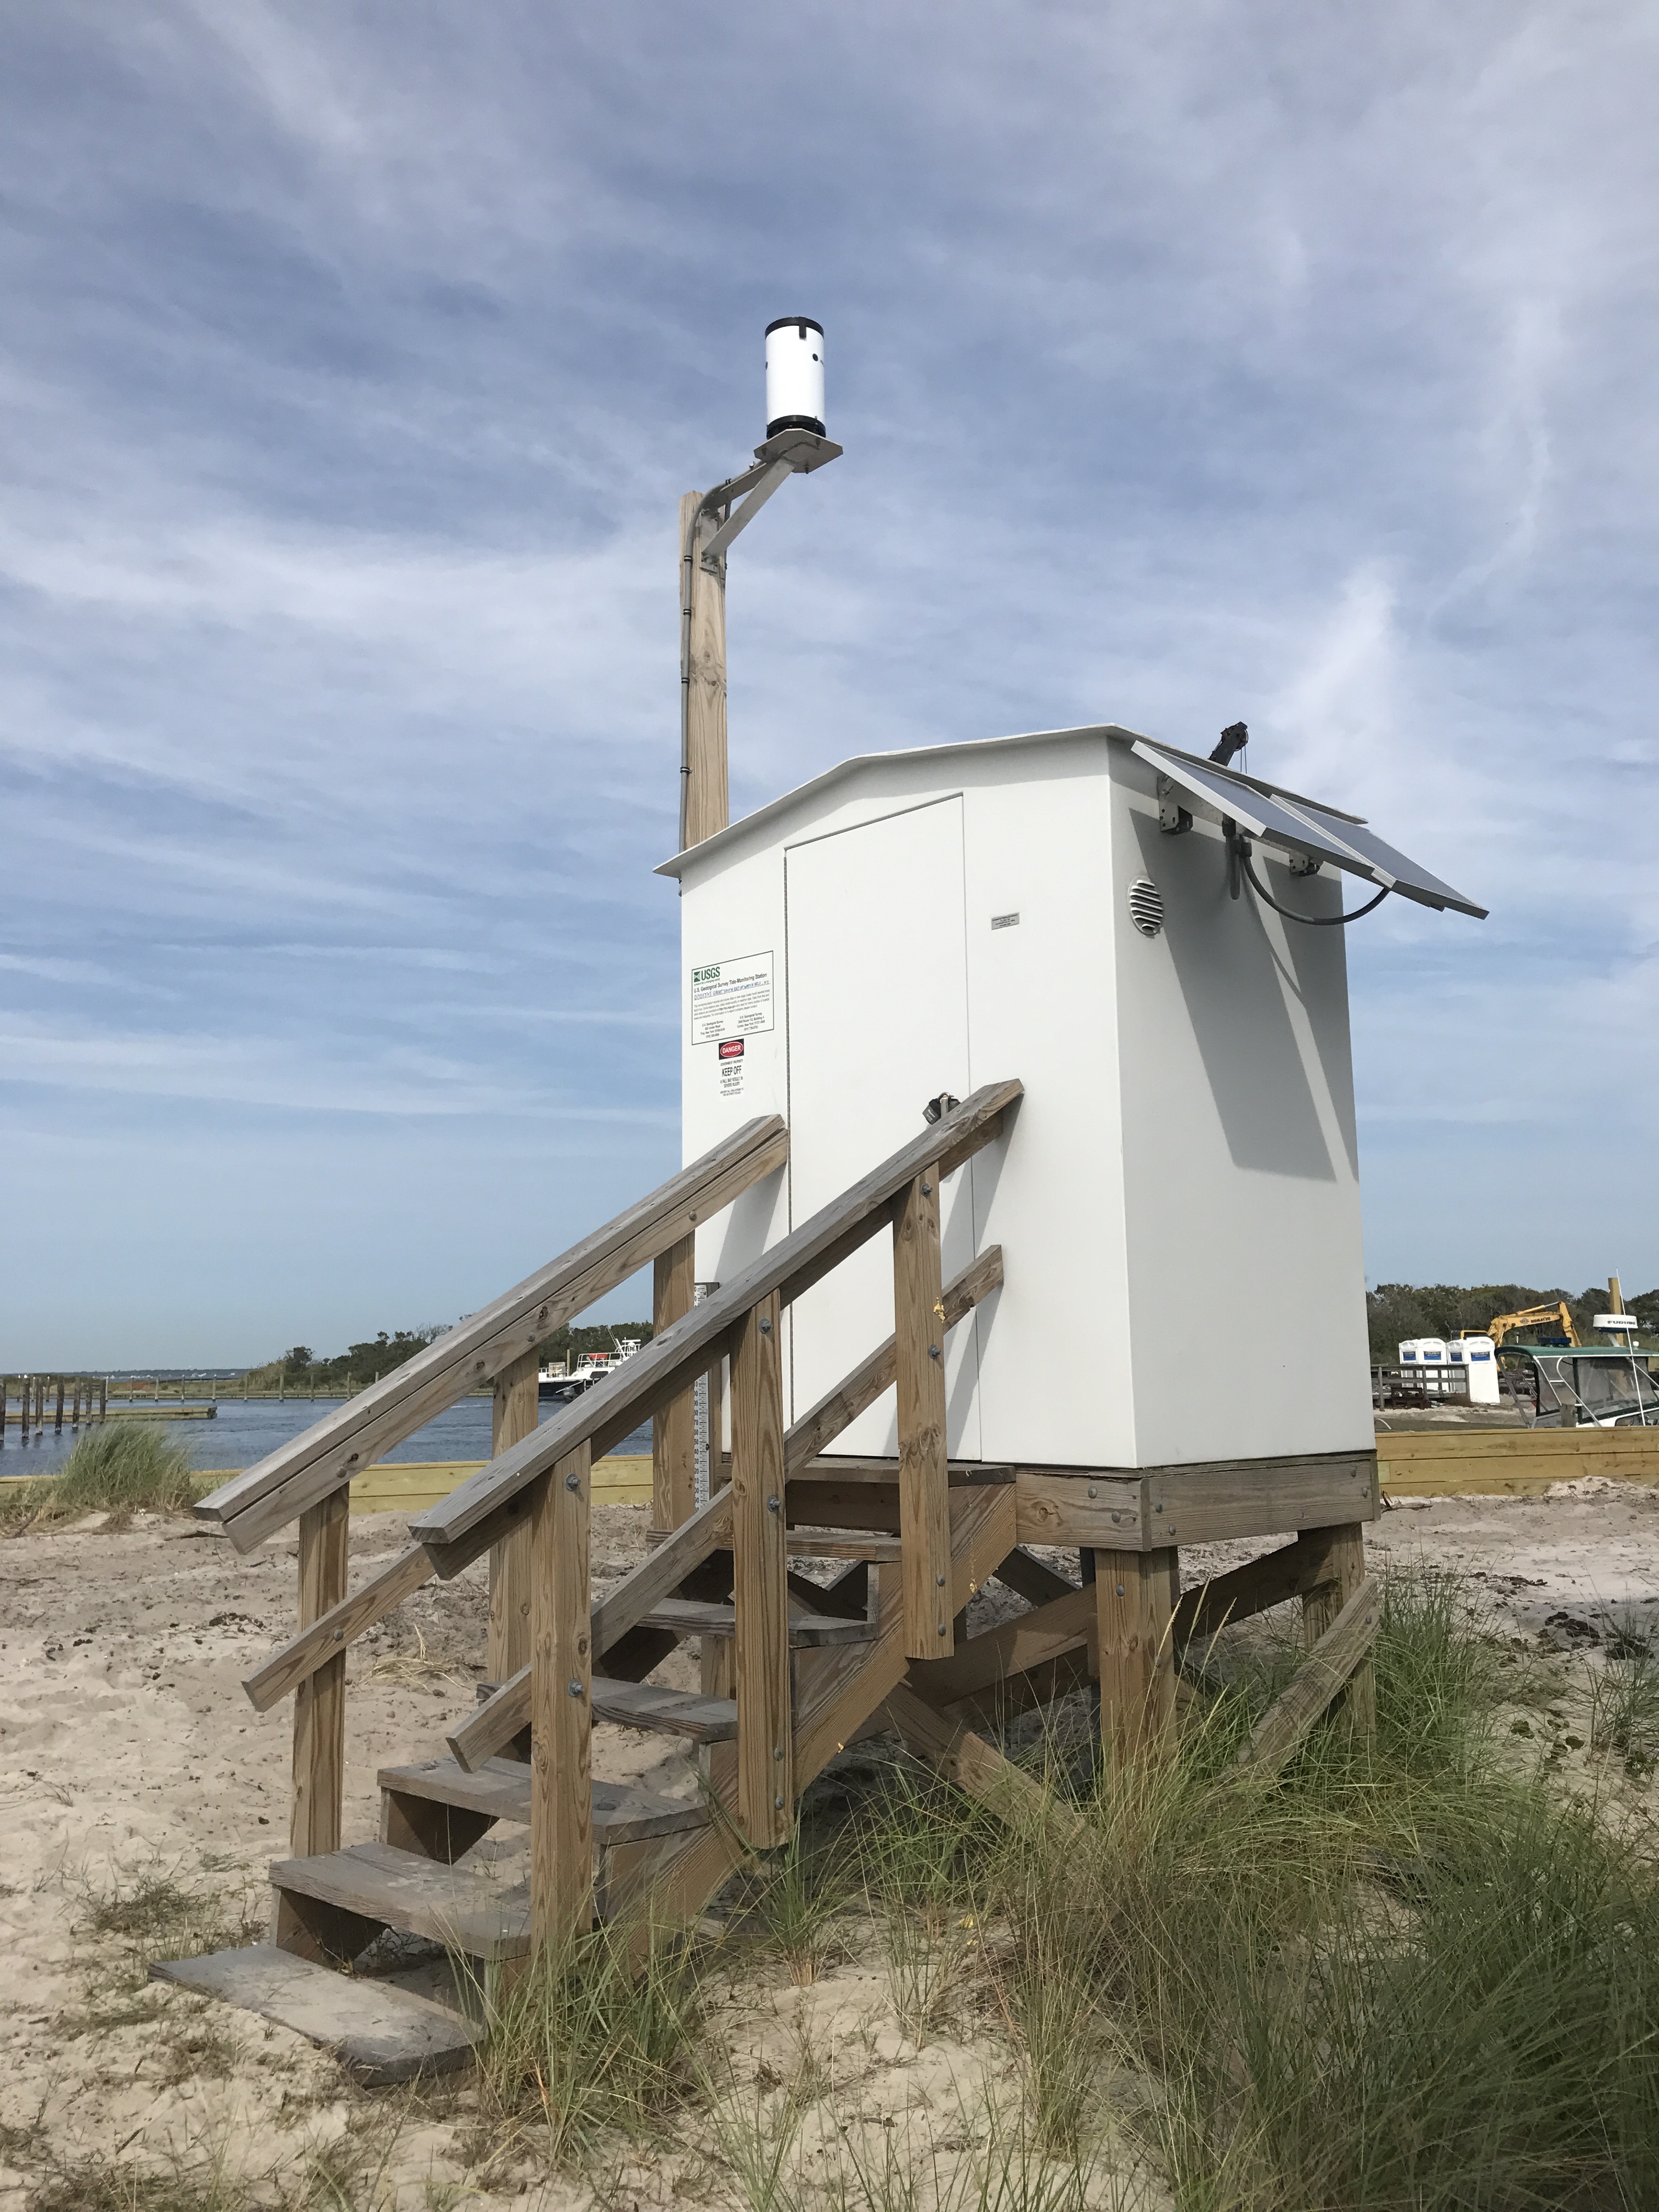 Station image
 Water elevation, astronomical-tide elevation, and residual water level Graph updated every 15 minutes Alternate link to graph |
 Wind speed, wind gust speed, and barometric pressure Graph updated hourly Alternate link to graph |
Summary of all available data for this site
Instantaneous-data availability statement


