PROVISIONAL DATA SUBJECT TO REVISION
Click to hidestation-specific text
Funding for this site is provided by:
 Site Information
LOCATION.--Lat 40°41'20.4", long
73°27'19.4" referenced to North American Datum of
1983, Nassau County, NY, Hydrologic Unit 02030202, on left bank
3,000 ft upstream from bridge on Clark Boulevard in Massapequa,
and 350 ft west of Lake Shore Drive at Garfield Street in
Massapequa Park.
DRAINAGE AREA.--38.6 mi².
PERIOD OF RECORD.--June to October 1903, published in Professional Paper 44, December 1936 to March 2000 (monthly means estimated December 1959 to February 1961), May 2005 to September 2010, October 2012 to current year. Published as Massatayun Creek at Massapequa, December 1936 to September 1941.
REVISIONS HISTORY.--WRD NY 1970: 1966-69 (M). WDR NY-09-2: Drainage area.
GAGE.--Water-stage recorder and concrete control. Datum of gage is 18.31 ft above NGVD of 1929 and 17.12 ft above NAVD of 1988 (VERTCON). Prior to October 1903, non-recording gage at different datum. December 1936 to March 1961, at datum 1.00 ft higher.
REMARKS.--Water Years 2014-22: Records fair except those for estimated daily discharges, which are poor.
EXTREMES FOR PERIOD OF RECORD.--Maximum discharge, 510 ft³/s, July 29, 1980, gage height, 2.40 ft, from rating curve extended above 200 ft³/s; minimum discharge, 0.23 ft³/s, Aug. 31, Sept. 1, 2016; minimum gage height, 0.32 ft, Aug. 1, 1954, datum then in use.
 WaterAlert – get an
email or text (SMS) alert based on your chosen threshold.
WaterAlert – get an
email or text (SMS) alert based on your chosen threshold.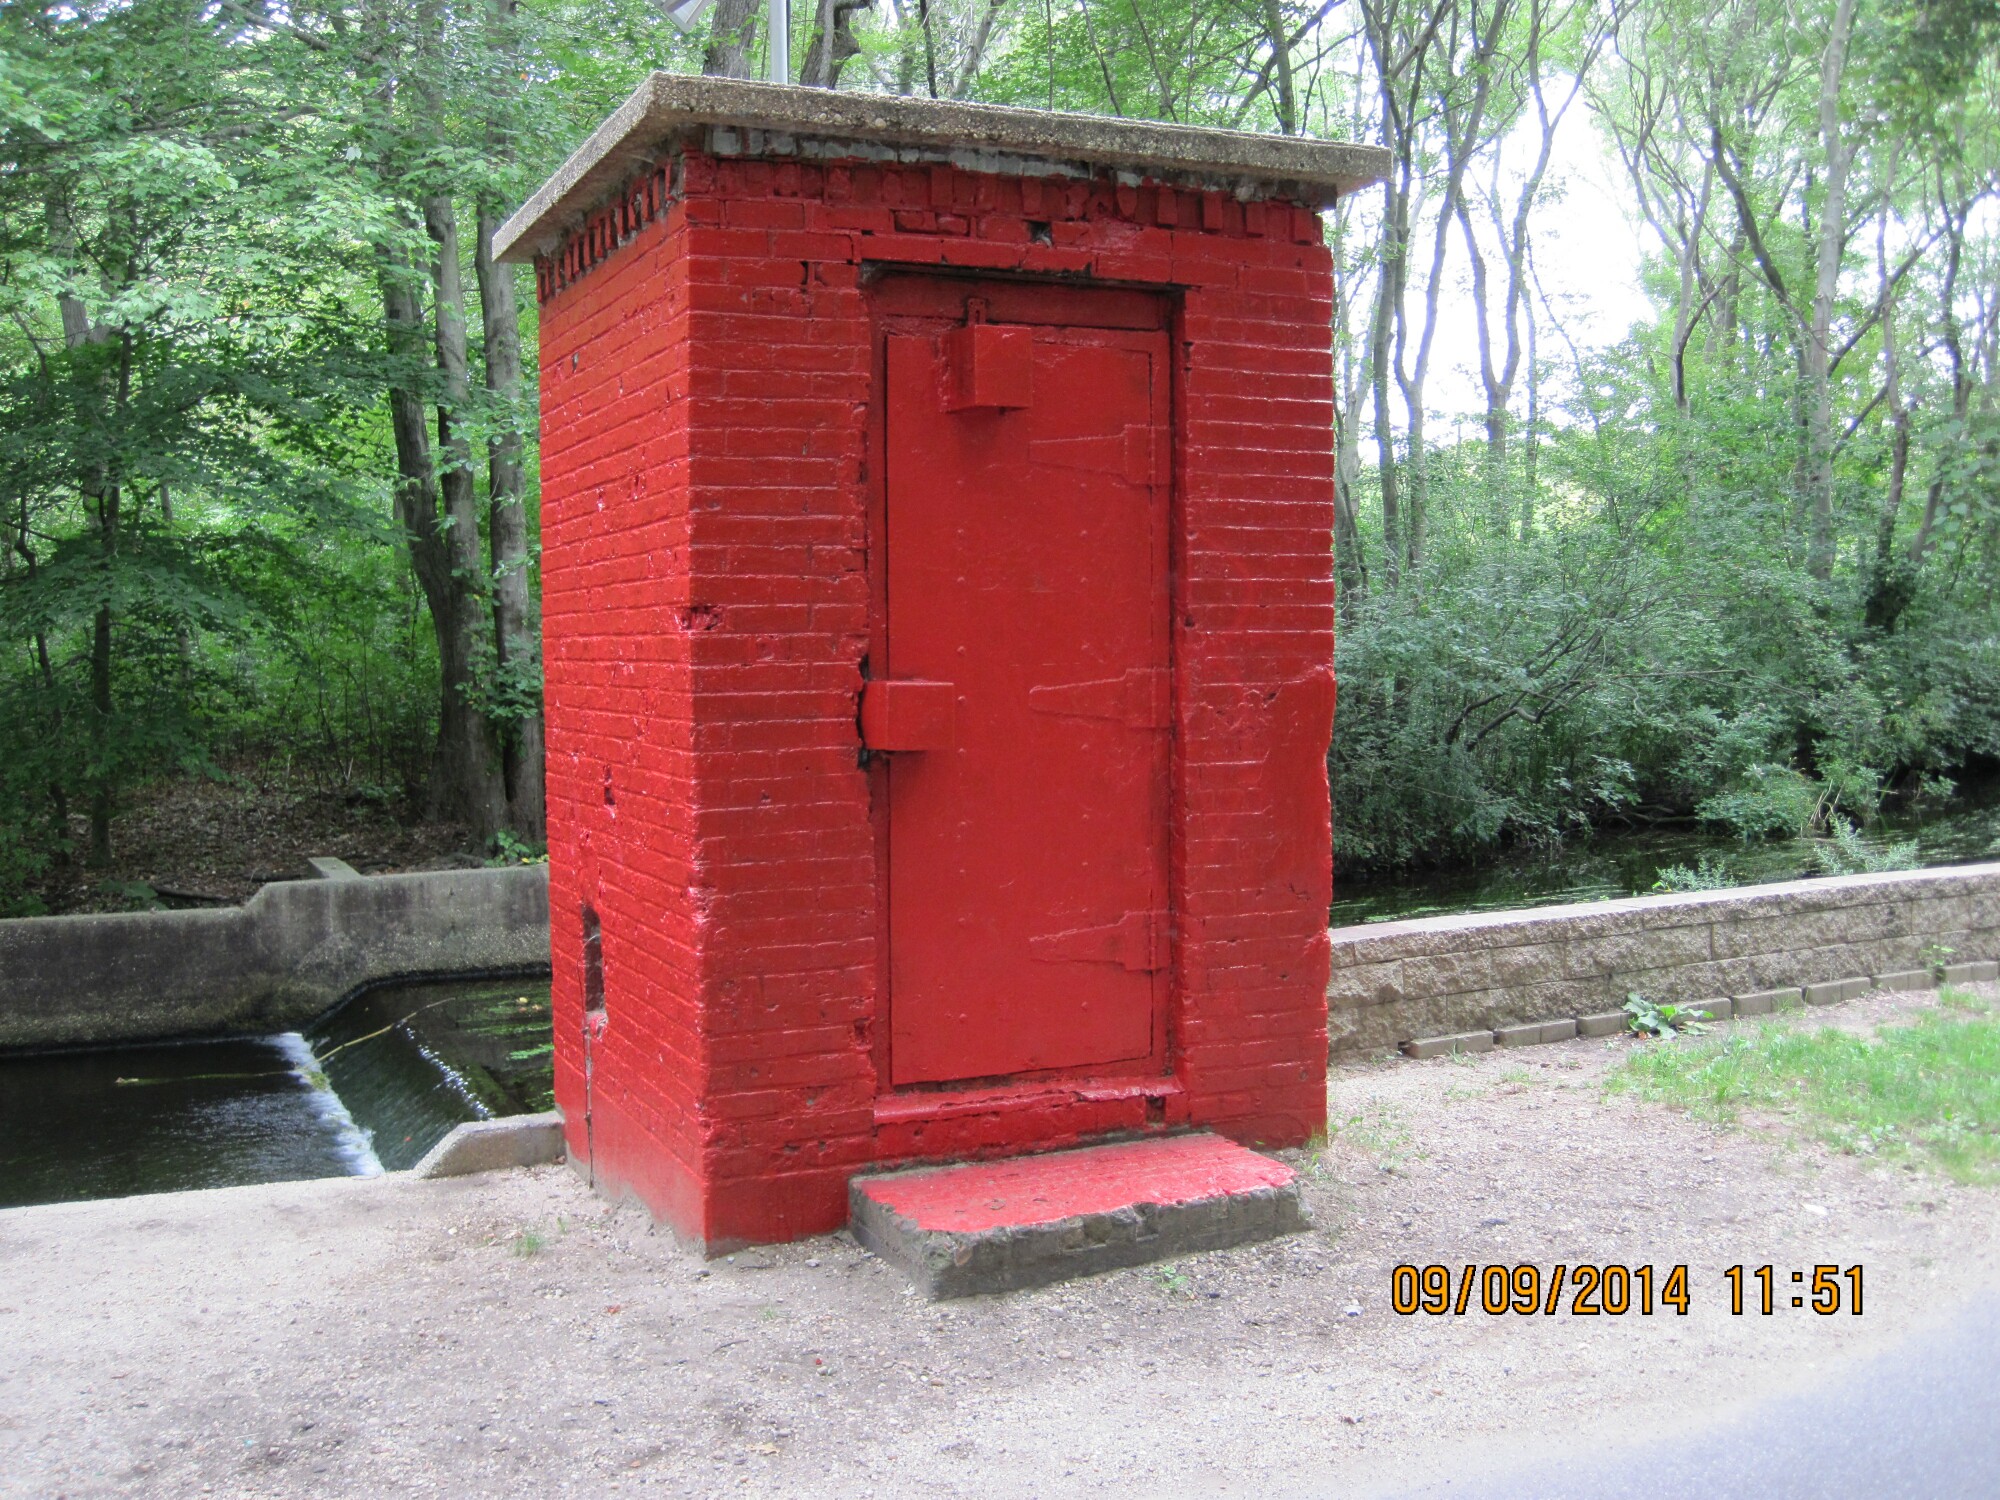 Station image
Summary of all available data for this site
Instantaneous-data availability statement

