PROVISIONAL DATA SUBJECT TO REVISION
 Site Information
-
LOCATION.--Lat 40°35'36", long 73°35'03" referenced to North American Datum of 1927, Nassau County, NY, Hydrologic Unit 02030202, at Town of Hempstead East Marina, 750 ft east of Loop Parkway Bridge, in Point Lookout. Water-quality monitor at site 100 ft north.
PERIOD OF RECORD.--December 1997 to current year. January 1974 to June 1994, in files of Town of Hempstead Department of Conservation & Waterways. Precipitation, wind speed and direction, air temperature, relative humidity, and barometric pressure records for March 1998 to current year, and solar radiation records for August 2004 to current year, are unpublished and available in files of the Geological Survey.
GAGE.--Water-stage recorder. Datum of gage is NGVD of 1929. January 1974 to June 1994, water-stage recorder at site 150 ft northeast.
REMARKS.--ELEVATION WY 2014: Records rated good, except those for Oct. 1-22, Oct. 28 to Jan. 19, Jan. 29, June 21 to July 6, Aug. 12-18, 26-31, Sept. 11-20, which are fair, Oct. 23-27, Jan. 20-28, Jan. 30 to June 20, July 31 to Aug. 11, Sept. 1-10, 29-30, which are poor and July 7-30 which were deleted. Periods of missing record were estimated with MISTE using a linear regression with 01310521 and 01311143. Satellite and telephone elevation, precipitation, and wind speed and direction telemeters at station. Telephone telemeter for air temperature, relative humidity, barometric pressure, and solar radiation parameters at station.
EXTREMES FOR PERIOD OF RECORD.--Maximum elevation, 9.90 ft, Oct. 29, 2012; minimum elevation, -4.28 ft, Mar. 9, 2005.
EXTREMES OUTSIDE PERIOD OF RECORD.--Storm tide of Sept. 27, 1985, reached an elevation of 7.3 ft, from information provided by Town of Hempstead Department of Conservation & Waterways. Storm tide of Dec. 11, 1992, reached an elevation of 7.3 ft, from high-water mark at site 4.0 mi west. Minimum elevation recorded, -4.9 ft, Jan. 11, 1978, Mar. 16, 1980, from information provided by Town of Hempstead Department of Conservation & Waterways.
PERIOD OF RECORD1.--October 2004 to current year. Water temperature records for March 1998 to September 2004, and sampling depth records for October 2004 to current year are unpublished and available in files of the Geological Survey.
PERIOD OF DAILY RECORD1.-- WATER TEMPERATURE: October 2004 to current year.
SALINITY: October 2004 to current year.
DISSOLVED OXYGEN: October 2004 to current year.
TURBIDITY: October 2004 to current year.
CHLOROPHYLL: August 2006 to current year.
INSTRUMENTATION1.--Water-quality monitor provides 12-minute-interval readings collected from 1.6 ft above bottom. October 2004 to February 2005, water-quality monitor provided 6-minute-interval readings. Salinity record computed from specific-conductance readings.
REMARKS1.--Telephone telemeter for water temperature, specific conductance, dissolved oxygen, turbidity, chlorophyll, and sampling depth parameters at station. WATER TEMPERATURE WY 2016: Records excellent. SALINITY WY 2016: Records excellent, except those for Nov. 8-10, May 3 to June 2, June 29 to July 3, July 8-15, Aug. 3, Sept. 7-19, which are good, July 4-5, 16-21, Aug. 4, Sept. 20-29, which are fair, and July 22 to Aug. 2, Aug. 5-8, which are poor. DISSOLVED OXYGEN WY 2016: Records excellent, except those for Oct. 11 to Nov. 10, Dec. 19 to Jan. 6, Apr. 5-15, July 1-5, and July 20 to Aug. 2, which are good. TURBIDITY WY 2016: Records excellent, except those for Oct. 15, 17, 20-21, 24-27, Nov. 2-5, 7, 10, Apr. 20-28, June 23 to July 5, July 17-26, which are good, Oct. 28 to Nov. 1, Nov. 6, 8-9, Apr. 29 to May 3, July 27 to Aug. 2, which are fair, May 4-25, which are poor, and May 26 to June 2, which were deleted. CHLOROPHYLL WY 2016: Records excellent, except those for Nov. 5, 7-11, Feb. 6 to Mar. 2, Apr. 19-29, May 3-5, July 7-8, which are good, Apr. 30 to May 2, May 6-9, July 9-10, which are fair, May 10 to June 2, July 11-16, which are poor and July 17 to Aug. 2 which were deleted.
EXTREMES FOR PERIOD OF RECORD1.--WATER TEMPERATURE: Maximum, 28.8 °C, July 22, 2020; minimum, -1.8 °C, Feb. 20, 2015. SALINITY: Maximum, 35 psu, Aug. 19, 2014; minimum, 21 psu, Oct. 14, 15, 2005. DISSOLVED OXYGEN: Maximum, 15.9 mg/L, Mar. 1, 2007; minimum, 1.5 mg/L, Sept. 3, 2014. TURBIDITY: Maximum, 410 FNU, Sept. 14, 2013; minimum, <0.1 FNU several days each year 2005-2016. CHLOROPHYLL: Maximum, 110 ug/L, May 22, 2014; minimum, <0.1 ug/L many days each year 2006-2016.
1 Water-Quality Records
 WaterAlert – get an email or text (SMS) alert based on your chosen threshold.
 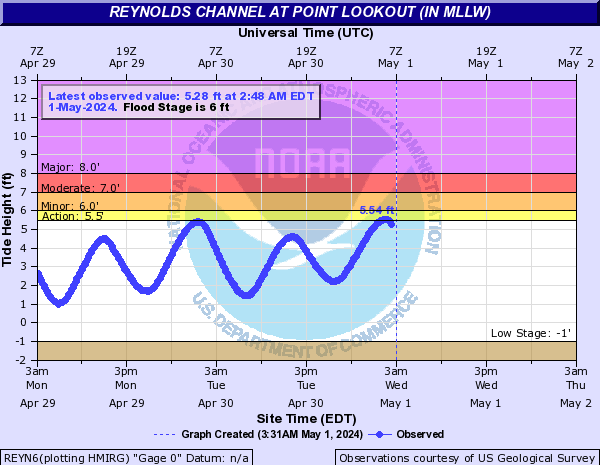 Additional Site Information
Peak Flow and Stage Information
NAVD 1988 Datum Conversion Information
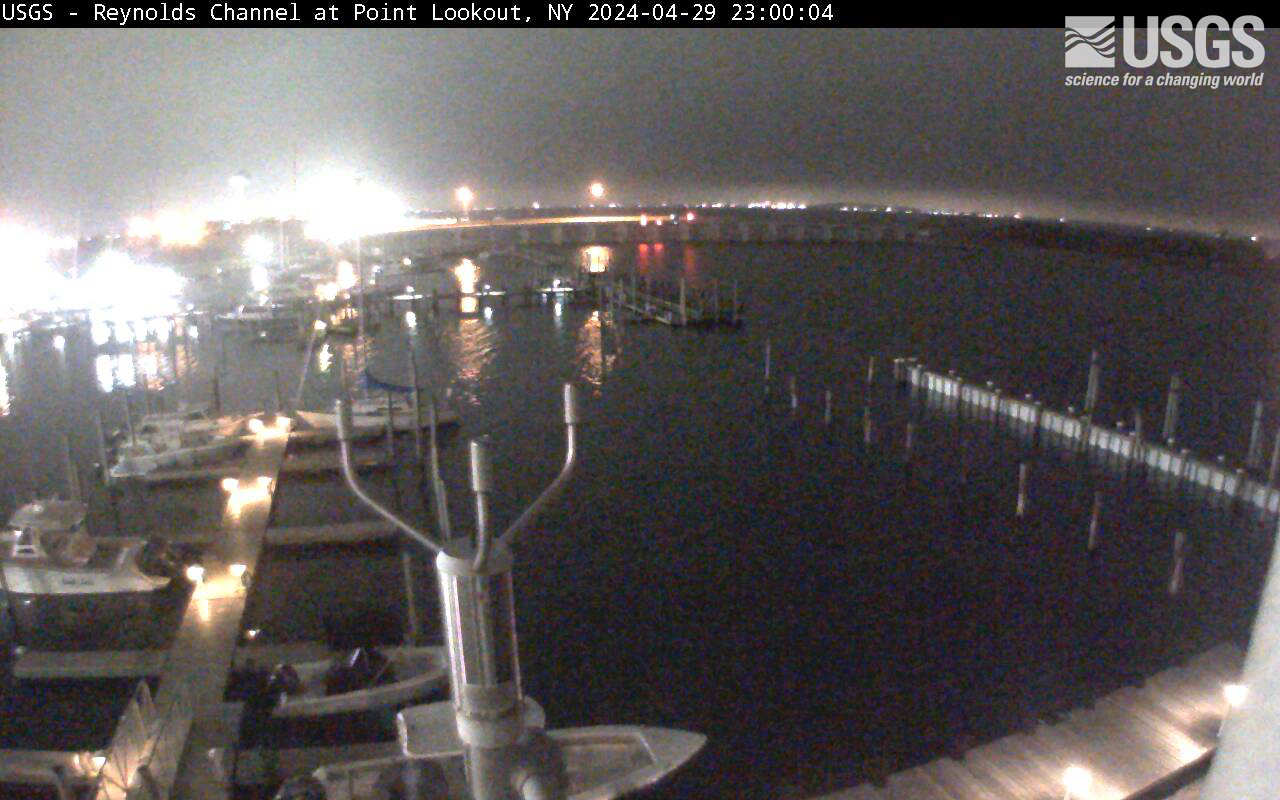
Webcam view of Reynolds Channel Picture updated hourly
Webcam view of Atlantic Ocean shore
Elevation observations and tidal predictions for this station are reported to NGVD 1929. To convert data to NAVD 1988 subtract 1.13 ft. To convert data to MHHW datum subtract 3.35 ft. To convert data to MLLW datum add 1.27 ft. These corrections vary from site to site.
NGVD 1929 is the National Geodetic Vertical Datum of 1929, formerly called "mean sea level" or "Sea Level Datum of 1929." NGVD 1929 was a general adjustment of the first-order level nets fit to mean sea level at 26 tide gages in the US and Canada.
NAVD 1988 is the North American Vertical Datum of 1988, which is a geodetic datum derived from a general adjustment of the first-order level nets fit to 1 tide gage in eastern Canada.
MHHW is mean higher high water, which is a site-specific datum determined by averaging the highest of the 2 high tides that occur each day over a 19-year tidal epoch. For tide gages with less than 19 years of record, this datum is estimated by correlation with long-term tide gages.
MLLW is mean lower low water, which is a site-specific datum determined by averaging the lowest of the 2 low tides that occur each day over a 19-year tidal epoch. For tide gages with less than 19 years of record, this datum is estimated by correlation with long-term tide gages.
Additional sensor graph(s) available (click on graph or sensor name)
 Water elevation, astronomical-tide elevation, and residual water level Graph updated every 15 minutes Alternate link to graph |
 Wind speed, wind gust speed, and barometric pressure Graph updated hourly Alternate link to graph |
Click on time-lapse image to see the latest full size video. Click on the Static Image to view the latest image For mobile devices, click this link.
 |
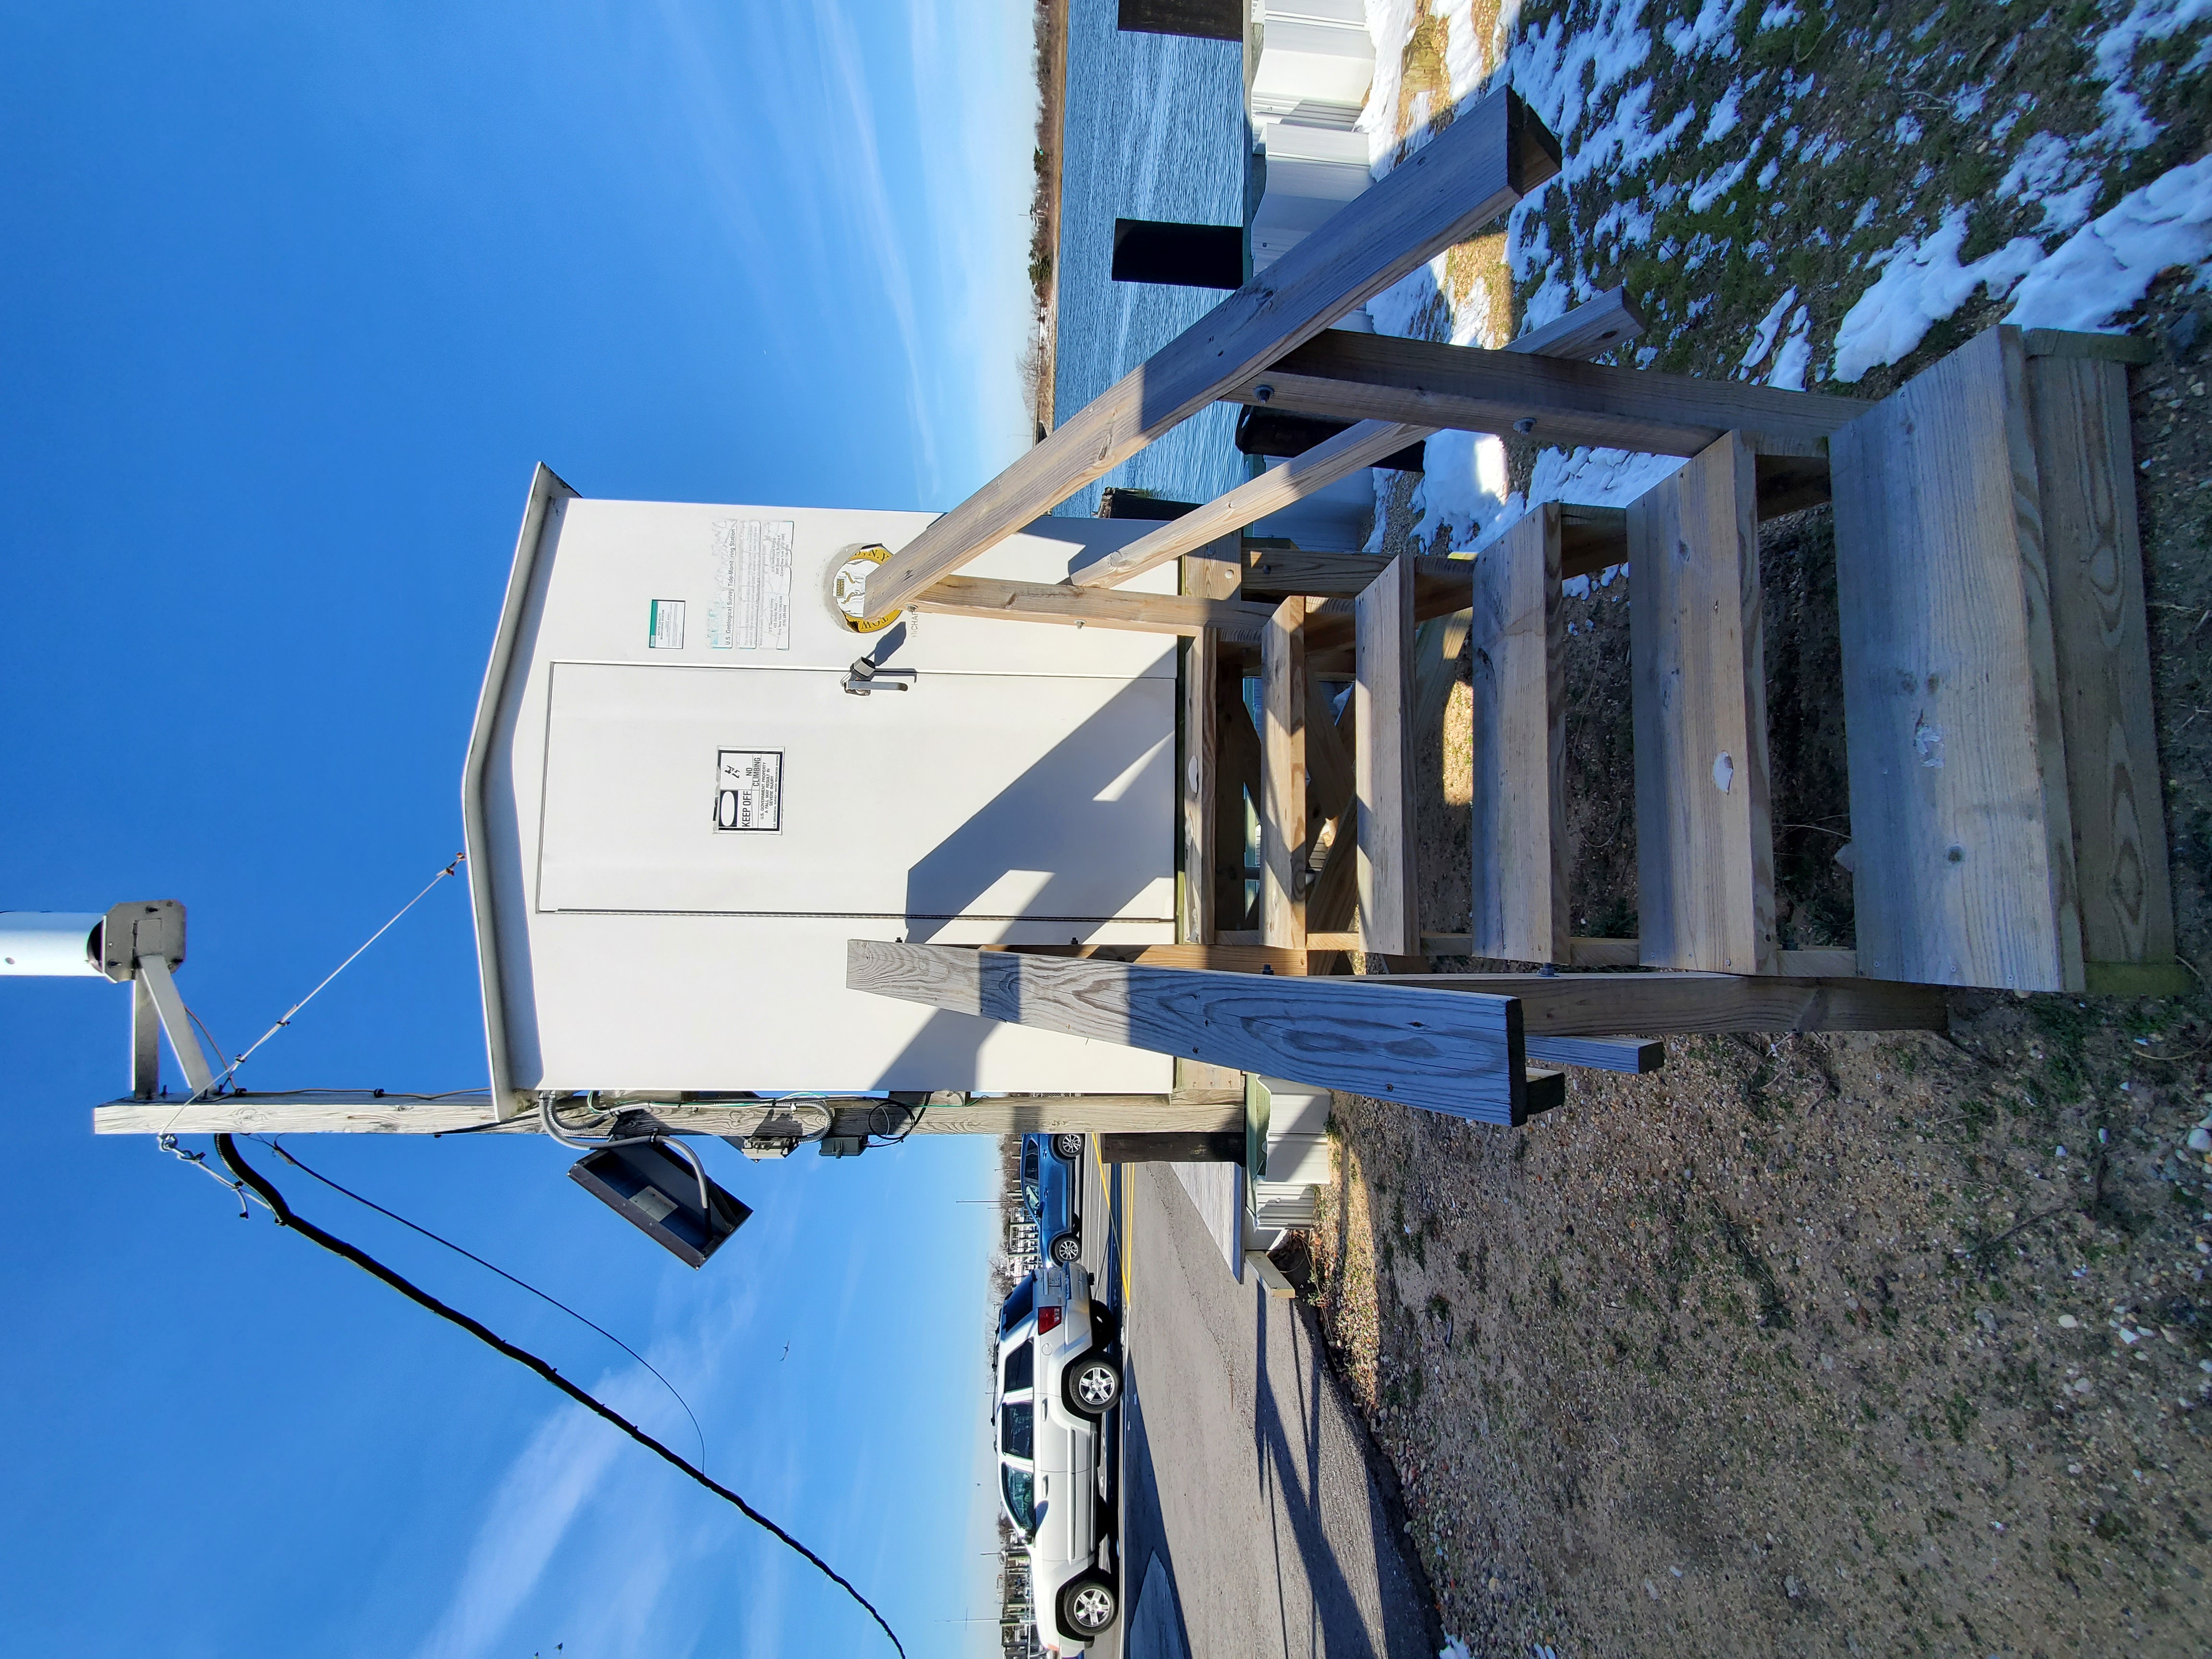 Station image
Summary of all available data for this site
Instantaneous-data availability statement


