PROVISIONAL DATA SUBJECT TO REVISION
Click to hidestation-specific text
Funding for this site is provided by:
 Site Information
-
LOCATION.--Lat 42°47'07.4", long 73°42'28.0" referenced to North American Datum of 1983, Albany County, NY, Hydrologic Unit 02020004, on right bank at School Street powerplant in Cohoes, and 2.0 mi upstream from mouth. Water-quality sampling site at bridge on State Highway 32, 0.75 mi below gage.
DRAINAGE AREA.--3,450 mi².
PERIOD OF RECORD.--December 1917 to current year. Prior to July 17, 1925, published as "at Crescent Dam".
REVISIONS HISTORY.--WSP 1302: 1919-23 (M). WDR NY-90-1: Drainage area.
GAGE.--Water-stage recorder and crest-stage gage. Datum of gage is 49.13 ft above NGVD of 1929 and 48.47 ft above NAVD of 1988. Dec. 1, 1917, to July 16, 1925, at site 1.7 mi upstream at Crescent Dam at datum 130.87 ft higher. July 17 to Oct. 19, 1925, powerplant gage at present site.
COOPERATION.--Diversions through Erie (Barge) Canal at Lock 6 (station 01357499) provided by New York State Canal Corporation.
REMARKS.--Flow published for this site may be affected by diversions for municipal water supplies upstream from station. Total flow of Mohawk River equals flow published at Cohoes which since October 2006 does not include small diversion for Cohoes water supply, plus flow diverted at Crescent Dam (station 01357499) to Erie (Barge) Canal through Lock 6. Prior to 1926 records published as total flow.
Water Years 2014-23: Records fair except those below 1,000 ft³/s, which are poor.
EXTREMES FOR PERIOD OF RECORD.--Maximum discharge, 143,000 ft³/s, Mar. 6, 1964, result of release from ice jam, gage height, 23.15 ft; minimum discharge (water years 1918-90), 6 ft³/s, Sept. 18, 1941, gage height, 3.40 ft.
EXTREMES OUTSIDE PERIOD OF RECORD.--An extreme flood occurred sometime from 1860-65 with a depth of 12 ft on the Cohoes dam and a peak discharge estimated to be at least 200,000 ft³/s (from New York State Museum Bulletin 85).
PERIOD OF DAILY RECORD1.--ORGANIC CARBON: March 1999 to August 2000.
WATER TEMPERATURE: May 1956 to June 1959.
SUSPENDED-SEDIMENT DISCHARGE: January 1954 to June 1959, August 1976 to September 1979, March 1999 to August 2000, October 2004 to current year.
EXTREMES FOR PERIOD OF DAILY RECORD1.--DISSOLVED-ORGANIC-CARBON CONCENTRATION: Maximum daily mean, 5.6 mg/L on several days; minimum daily mean, 2.8 mg/L, Apr. 5, 1999.
DISSOLVED-ORGANIC-CARBON DISCHARGE: Maximum daily, 634 tons, June 7, 2000; minimum daily, 2.1 tons, Sept. 4, 1999.
PARTICULATE-ORGANIC-CARBON CONCENTRATION: Maximum daily mean, 13.7 mg/L, Feb. 29, 2000; minimum daily mean, 0.2 mg/L on many days.
PARTICULATE-ORGANIC-CARBON DISCHARGE: Maximum daily, 2,085 tons, Feb. 29, 2000; minimum daily, 0.1 ton, Sept. 4, 1999.
WATER TEMPERATURE (water years 1956-59): Maximum daily, 28.0°C, July 21, 1957; minimum daily, 0.0°C on many days during winter periods.
SUSPENDED-SEDIMENT CONCENTRATION (water years 1954-59, 1976-79, 1999-2000, 2005-16): Maximum daily mean, 2,510 mg/L, Aug. 29, 2011; minimum daily mean, 1 mg/L, Jan. 6, 1956, Jan. 6, 7, Feb. 21, 22, 25, 1977, on several days in 2005-06 water years, Aug. 24, 25, 2008, on several days in 2009-11 water years, Sept. 11, 26, 27, 2015.
SUSPENDED-SEDIMENT DISCHARGE (water years 1954-59, 1976-79, 1999-2000, 2005-16): Maximum daily, 694,000 tons, Aug. 29, 2011; minimum daily, 0.8 ton, Aug. 7, 1955.
1 Water-Quality Records
 WaterAlert – get an email or text (SMS) alert based on your chosen threshold.
  Additional Site Information
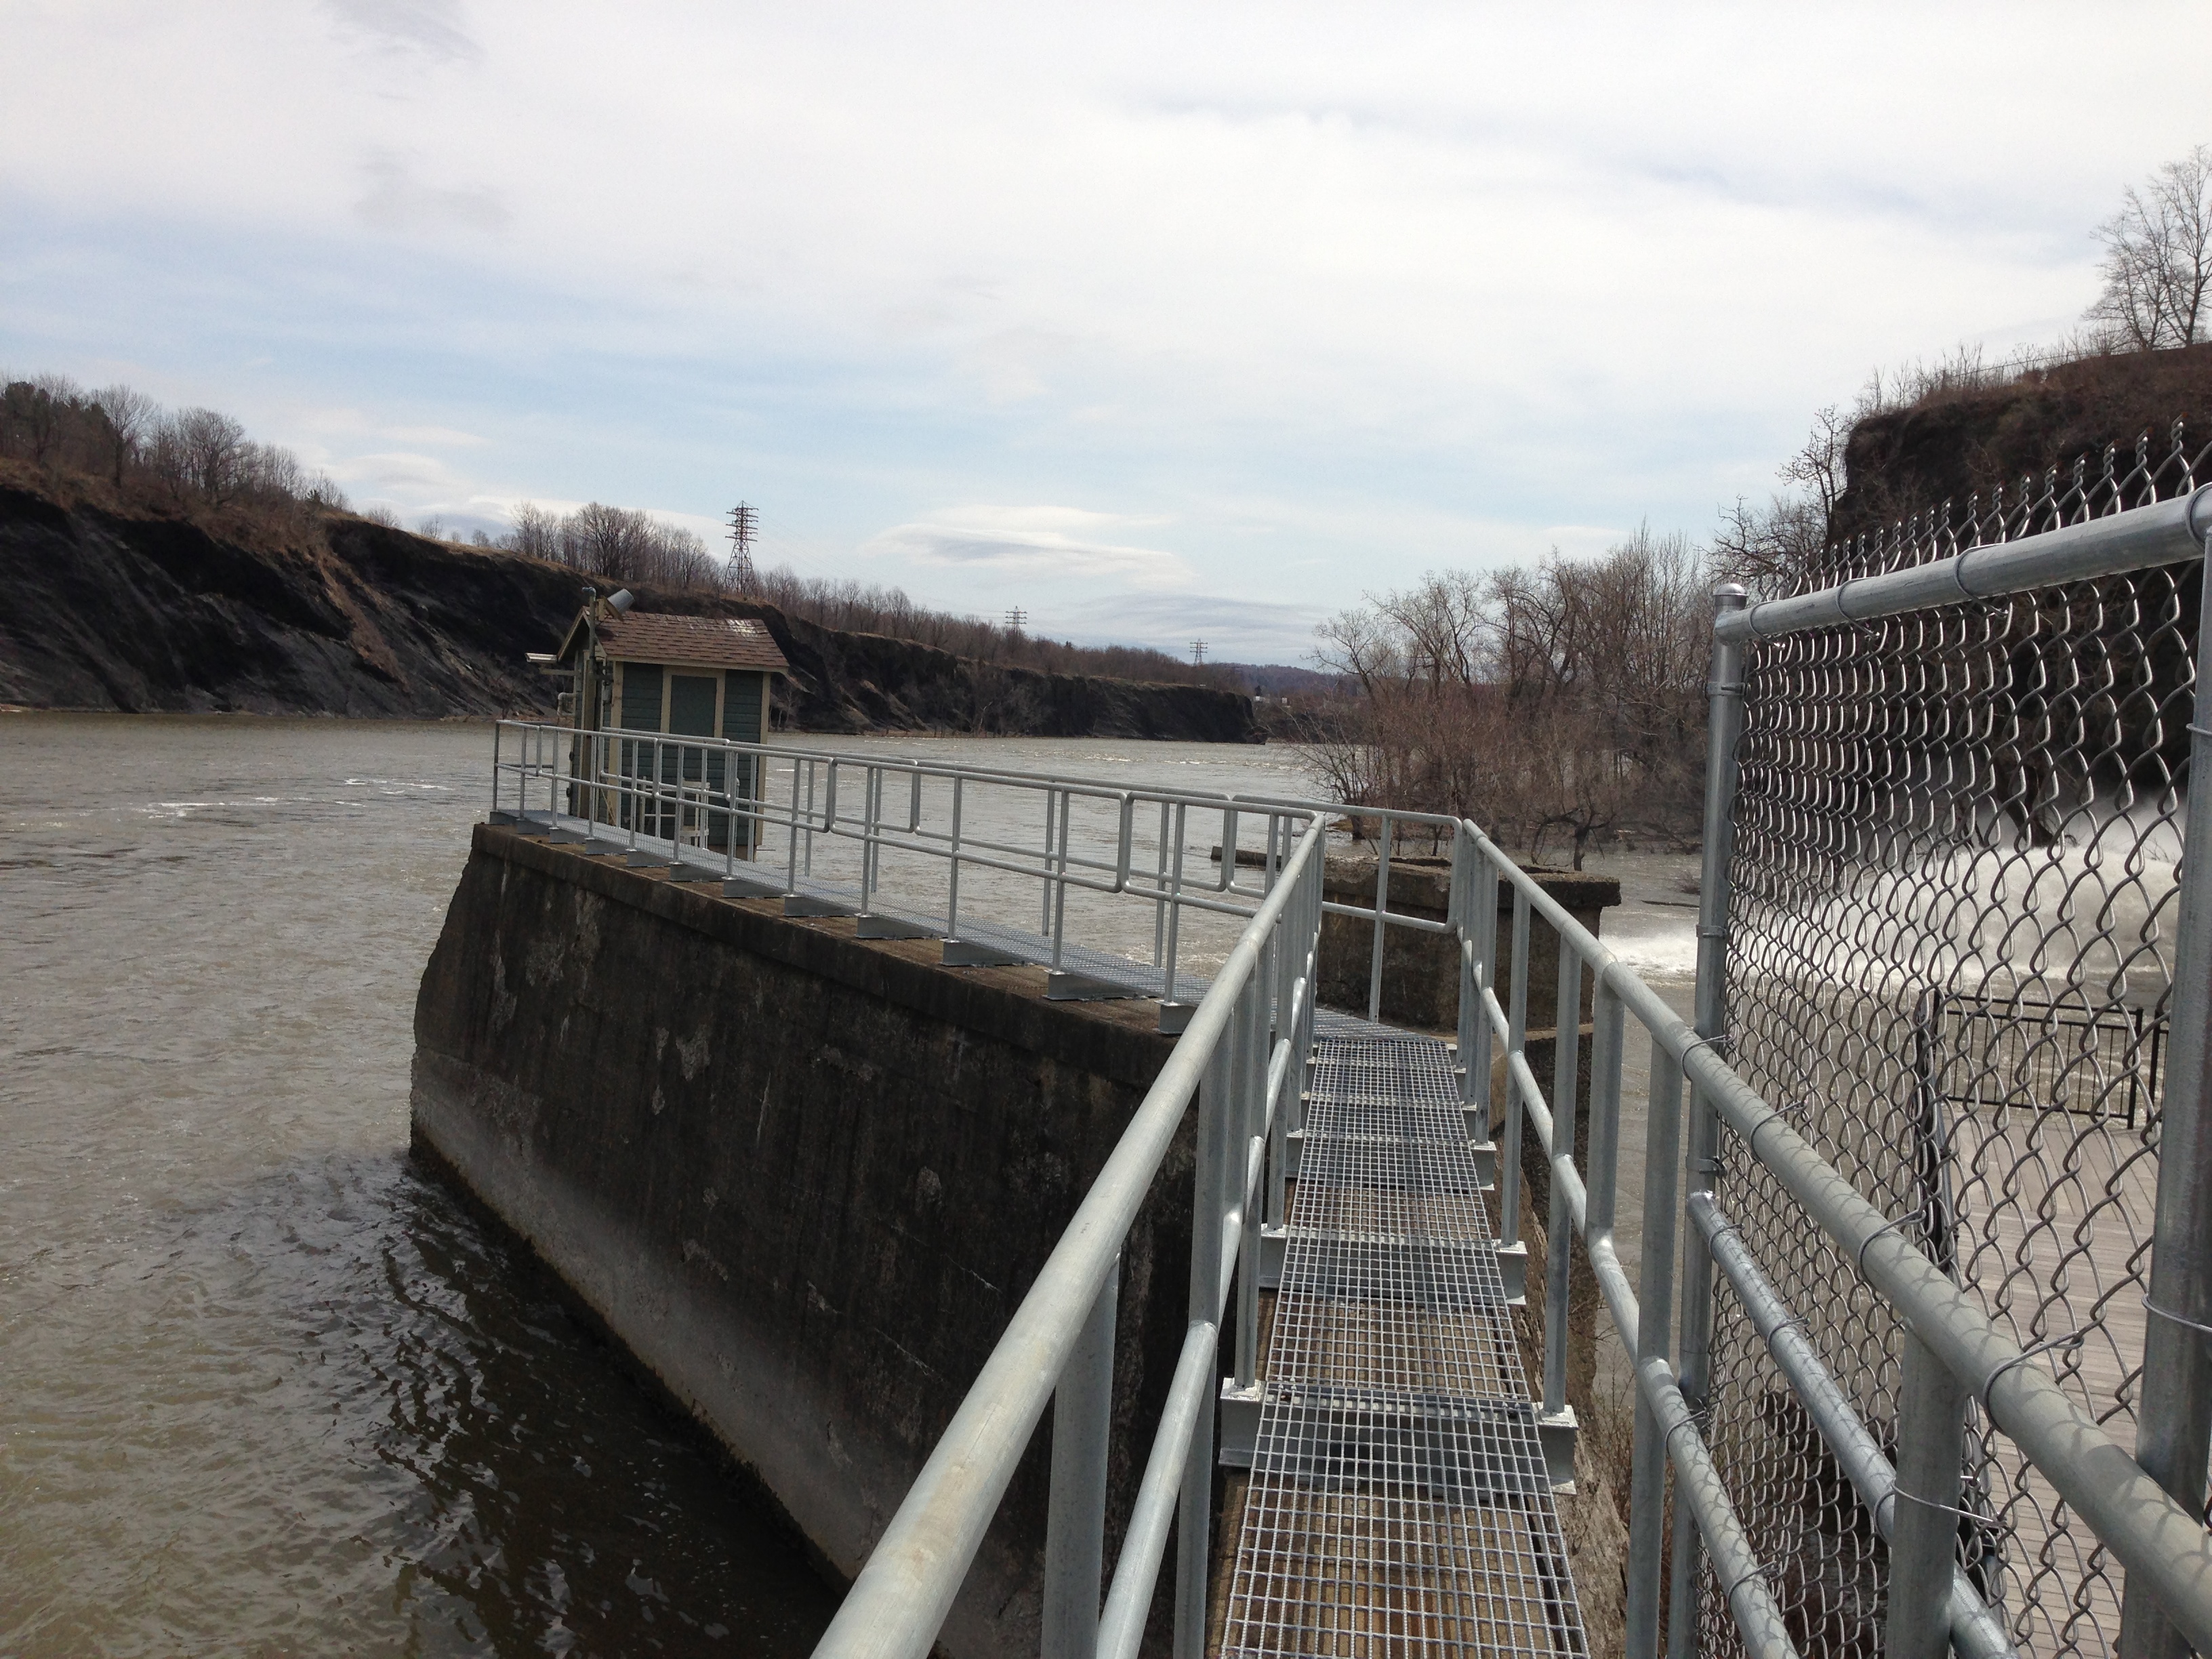
View of the Falls Picture updated every half-hour
Click on time-lapse image to see the latest full size video. Click on the Static Image to view the latest image For mobile devices, click this link.
 |
 Station image
Summary of all available data for this site
Instantaneous-data availability statement

