PROVISIONAL DATA SUBJECT TO REVISION
Click to hidestation-specific text
The 15-minute precipitation data for this
station are temporary and will only be displayed for 120 days.
Although the instrumentation is calibrated at least once/year, the
temporary classification means that documented routine inspections and
other quality assurance measures are not performed that would make the
data acceptable for archival, retrieval, or future use in general
scientific or interpretive studies.
 Site Information
Funding for this site is provided by:
Site Information
LOCATION.--Lat 42°37'10.3", long
73°45'32.1" referenced to North American Datum of
1983, Albany County, NY, Hydrologic Unit 02020006, on right
bank at the Port of Albany, 1.7 mi downstream from bridge
on U.S. Highway 90, and 7.9 mi upstream from
Castleton Bridge on State Highway 912M.
DRAINAGE AREA.--8,300 mi².
PERIOD OF RECORD.--October 2016 to current year.
GAGE.--Water-stage recorder, acoustic velocity meter, and crest-stage gage. Elevation record is provided in NGVD of 1929 and NAVD of 1988 datums. To convert NGVD of 1929 elevations to NAVD of 1988, subtract 0.75 ft.
REMARKS.--Blanks in table are the result of only one high or low tide during a day or interruption of record.
EXTREMES FOR PERIOD OF RECORD.--Maximum elevation, 9.00 ft above NGVD of 1929 (8.25 ft above NAVD of 1988), Dec. 18, 2023; minimum elevation, -4.52 ft above NGVD of 1929 (-5.27 ft above NAVD of 1988), Feb. 4, 2023.
PERIOD OF RECORD1.--May 2019 to current year.
PERIOD OF DAILY RECORD1.--WATER TEMPERATURE: May 2019 to current year.
SPECIFIC CONDUCTANCE: May 2019 to current year.
pH: May 2019 to current year.
DISSOLVED OXYGEN: May 2019 to current year.
TURBIDITY: May 2019 to current year.
INSTRUMENTATION1.--A multi-parameter water-quality sonde measures water temperature, specific conductance, pH, dissolved oxygen, and turbidity at 15-minute intervals since May 2019.
COOPERATION1.--Maintained by the Hudson River Environmental Conditions Observing System in cooperation with the New York State Department of Environmental Conservation.
EXTREMES FOR PERIOD OF DAILY RECORD1.--WATER TEMPERATURE: Maximum, 29.9°C, July 27, 2020; minimum, -0.1°C, Jan. 15, 2022.
SPECIFIC CONDUCTANCE: Maximum, 485 uS/cm @ 25°C, Mar. 5, 2021; minimum, 140 uS/cm @ 25°C, Apr. 16, 2023.
pH: Maximum, 9.1, July 27, 18, 2020; minimum, 7.3, on several days in August 2022.
DISSOLVED OXYGEN: Maximum, 17.4 mg/L, Dec. 21, 2019; minimum, 4.2 mg/L, Sept. 1, 2022.
TURBIDITY: May 3, 2019 to Feb. 27, 2023: Maximum, 833 FNU, Nov. 2, 2019; minimum, <0.3 FNU, on several days. [<, actual value is known to be less than the value shown] Mar. 23, 2023 to current year: Maximum, 572 FNU, July 10, 2023; minimum, 1.2 FNU, June 1, 2023.
1 Water-Quality Records
 WaterAlert – get an
email or text (SMS) alert based on your chosen threshold.
WaterAlert – get an
email or text (SMS) alert based on your chosen threshold.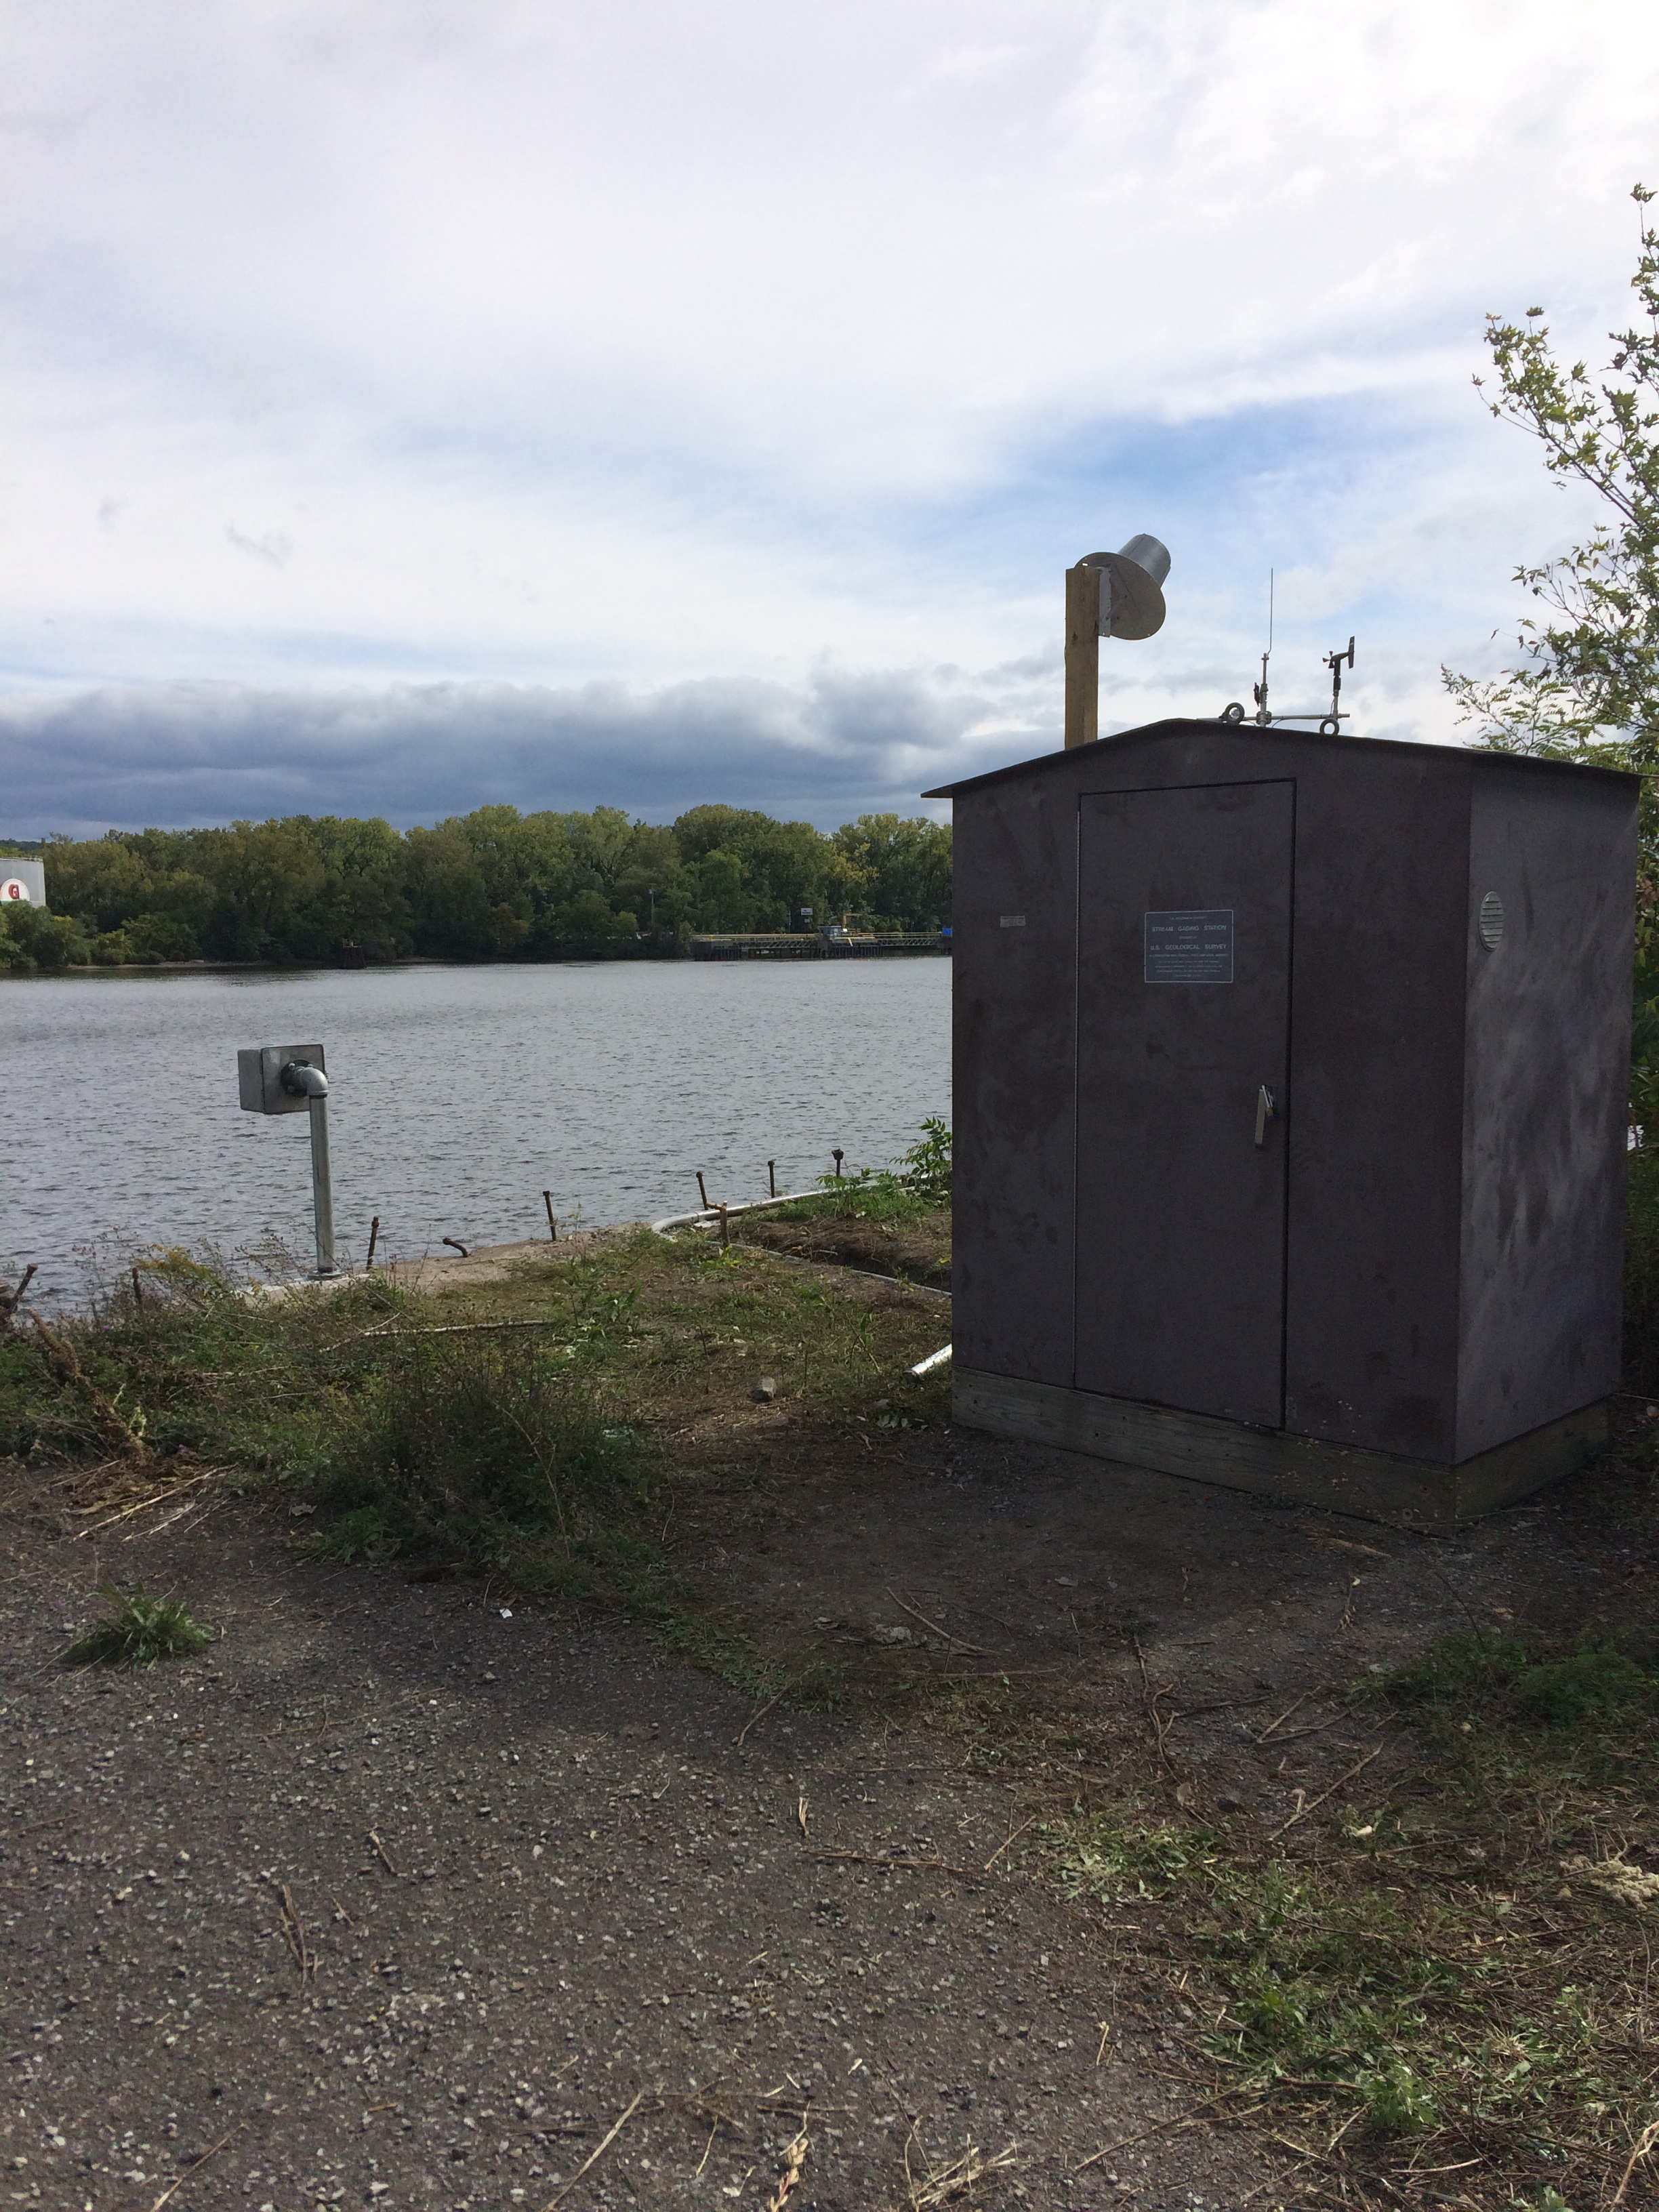 Station image
Summary of all available data for this site
Instantaneous-data availability statement


