PROVISIONAL DATA SUBJECT TO REVISION
Click to hidestation-specific text
Funding for this site is provided by:
 Site Information
LOCATION.--Lat 42°06'32", long
74°27'07" referenced to North American Datum of 1983,
Ulster County, NY, Hydrologic Unit 02020006, on left bank 10 ft
west of State Highway 28, and 0.1 mi upstream from bridge on
Lasher Road, at Big Indian.
DRAINAGE AREA.--12.5 mi².
PERIOD OF RECORD.--October 1998 to current year.
REVISIONS HISTORY.--WDR-US-2011: 2010.
GAGE.--Water-stage recorder and crest-stage gage. Datum of gage is 1,227.42 ft above NAVD of 1988.
REMARKS.--Seasonal diversion for snowmaking by Belleayre Mountain Ski Center at Pine Hill. Occasional regulation by Pine Hill Lake 1.7 mi upstream, and low flows may be affected by Pine Hill Wastewater Treatment Plant about 1.1 mi upstream.
Water Years 2014-23: Records fair except those for estimated daily discharges, which are poor.
EXTREMES FOR PERIOD OF RECORD.--Maximum discharge, 1,460 ft³/s, Aug. 28, 2011, gage height, 7.18 ft, outside gage height was 7.58 ft, from crest-stage gage, from rating curve extended above 260 ft³/s on basis of slope-area measurement of peak flow; minimum discharge, 1.6 ft³/s, Sept. 26, 2008; minimum gage height, 2.17 ft, Sept. 25, 26, 2010.
 WaterAlert – get an
email or text (SMS) alert based on your chosen threshold.
WaterAlert – get an
email or text (SMS) alert based on your chosen threshold.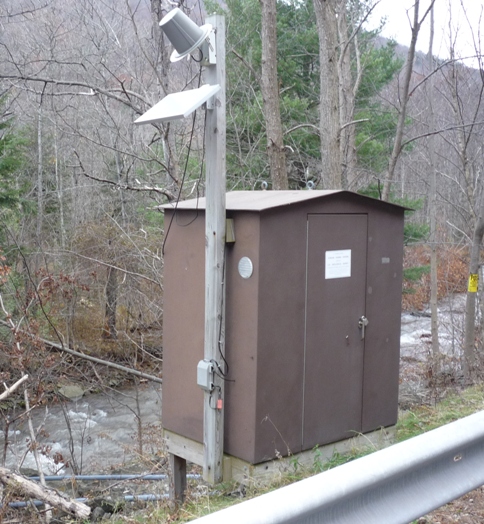 Station image
Summary of all available data for this site
Instantaneous-data availability statement

