PROVISIONAL DATA SUBJECT TO REVISION
Click to hidestation-specific text
Funding for this site is provided by:
 Site Information
LOCATION.--Lat 42°08'32", long
74°15'54" referenced to North American Datum of 1983,
Greene County, NY, Hydrologic Unit 02020006, on left bank
downstream from bridge on Diamond Notch Road, about 1.0 mi
upstream from mouth, and about 1.0 mi north of
Lanesville.
DRAINAGE AREA.--1.95 mi².
PERIOD OF RECORD.--Occasional miscellaneous discharge measurements, water years 1985-86, 1988-94. October 1997 to current year.
REVISIONS HISTORY.--Turbidity data for the period Oct. 20, 2020 to Dec. 24, 2020, were removed on Jan. 30, 2024, based on the publication criteria.
GAGE.--Water-stage recorder and crest-stage gage. Datum of gage is 1,476.46 ft above NAVD of 1988.
REMARKS.--Water Years 2014-23: Records fair except those for estimated daily discharges, which are poor.
EXTREMES FOR PERIOD OF RECORD.--Maximum discharge, 487 ft³/s, Aug. 28, 2011, gage height, 5.89 ft, from rating curve extended above 230 ft³/s on basis of step-backwater analysis; minimum, no flow Sept. 18, 19, 2001, as a result of temporary drainage of gage pool by local fire department; minimum gage height, 0.55 ft, Sept. 18, 2001.
PERIOD OF RECORD1.--February 2017 to October 2020, March 2021 to current year.
PERIOD OF DAILY RECORD1.--TURBIDITY: February 2017 to October 2020, March 2021 to current year.
INSTRUMENTATION1.--An optical turbidity sensor provides readings on a 15-minute interval since February 2017.
COOPERATION1.--In cooperation with the New York City Department of Environmental Protection.
EXTREMES FOR PERIOD OF DAILY RECORD1.--TURBIDITY: Maximum, 801 FNU, May 15, 2018; minimum, <0.2 FNU, on many days. [<, actual value is known to be less than the value shown]
1 Water-Quality Records
 WaterAlert – get an
email or text (SMS) alert based on your chosen threshold.
WaterAlert – get an
email or text (SMS) alert based on your chosen threshold.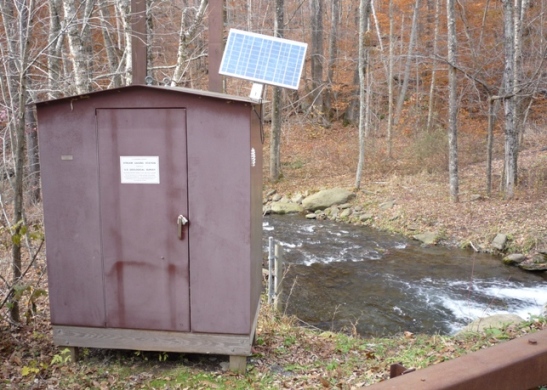 Station image
Summary of all available data for this site
Instantaneous-data availability statement

