PROVISIONAL DATA SUBJECT TO REVISION
Click to hidestation-specific text
Funding for this site is provided by:
 Site Information
LOCATION.--Lat 42°02'16", long
73°58'19" referenced to North American Datum of 1983,
Ulster County, NY, Hydrologic Unit 02020006, on left bank at
downstream side of bridge on Glasco Turnpike, 0.8 mi east of
Mount Marion, 1.6 mi downstream from Plattekill Creek, and 4.5
mi upstream from mouth.
DRAINAGE AREA.--419 mi².
PERIOD OF RECORD.--Occasional miscellaneous discharge measurements, 1902, 1951, 1956, 1966, 1967, 1969. April 1907 to December 1913 (furnished by Board of Water Supply, City of New York), January 1914 to March 1918 (monthly discharges only, furnished by Board of Water Supply, City of New York, published in WSP 1302), March 1970 to current year.
GAGE.--Water-stage recorder and crest-stage gage. Datum of gage is 40.15 ft above NGVD of 1929 and 39.36 ft above NAVD of 1988. Prior to Aug. 12, 1970, nonrecording gage at same site (at different datum April 1907 to March 1918).
REMARKS.--Flow from 256 mi² of drainage area regulated by Ashokan Reservoir since Sept. 9, 1913. Water diverted from Schoharie Creek through Shandaken Tunnel (station 01362230) since Feb. 3, 1924, enters Esopus Creek about 12.2 mi upstream from Ashokan Reservoir. Diversion from Plattekill Creek for water supply of village of Saugerties. Slight diversion at headwaters into Cooper Lake for water supply of Kingston. Diversions upstream during summer months for irrigation purposes. Diversions for water supply of city of New York made from Ashokan Reservoir (station 01363400). Discharge records for this station now represent the natural flow from 112 mi², together with conservation releases and spillage during high stages from the upstream reservoirs.
Water Years 2014-17: Records good except those for estimated daily discharges, which are fair. Water Years 2018-20: Records good except those for estimated daily discharges, which are poor. Water Years 2021-23: Records fair except those for estimated daily discharges, which are poor.
EXTREMES FOR PERIOD OF RECORD.--Maximum discharge, 30,500 ft³/s, Apr. 3, 2005, gage height, 26.46 ft, outside gage height was 26.19 ft, from crest-stage gage; minimum discharge, 5.3 ft³/s, Aug. 10, 1999, gage height, 11.51 ft.
PERIOD OF DAILY RECORD1.--SUSPENDED-SEDIMENT DISCHARGE: November 2013 to current year.
REMARKS1.--Turbidity data are collected every 15 minutes using an in-situ turbidity probe located in a separate 2 inch pipe about 10 ft upstream of the automatic sampler intake tubing. Daily suspended-sediment load and concentration are derived from a regression equation relating turbidity to suspended-sediment concentration.
EXTREMES FOR PERIOD OF DAILY RECORD1.--SUSPENDED-SEDIMENT CONCENTRATION: Maximum daily mean, 439 mg/L, July 16, 2014; minimum daily mean, 1 mg/L, Feb. 23, 24, 27, 2015.
SUSPENDED-SEDIMENT DISCHARGE: Maximum daily, 6,200 tons, Sept. 30, 2015; minimum daily, 0.23 ton, Sept. 8, 9, 2015.
1 Water-Quality Records
 WaterAlert – get an
email or text (SMS) alert based on your chosen threshold.
WaterAlert – get an
email or text (SMS) alert based on your chosen threshold.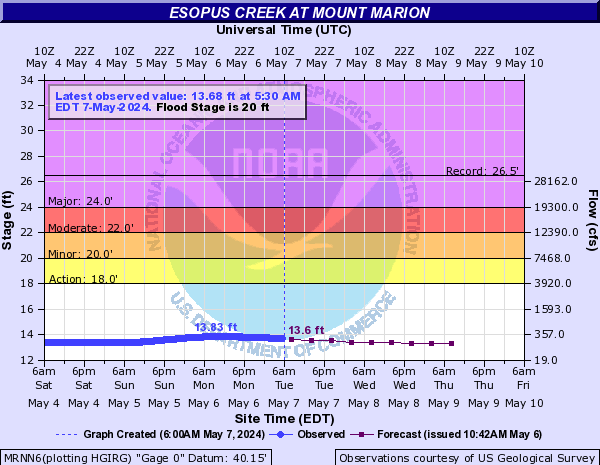
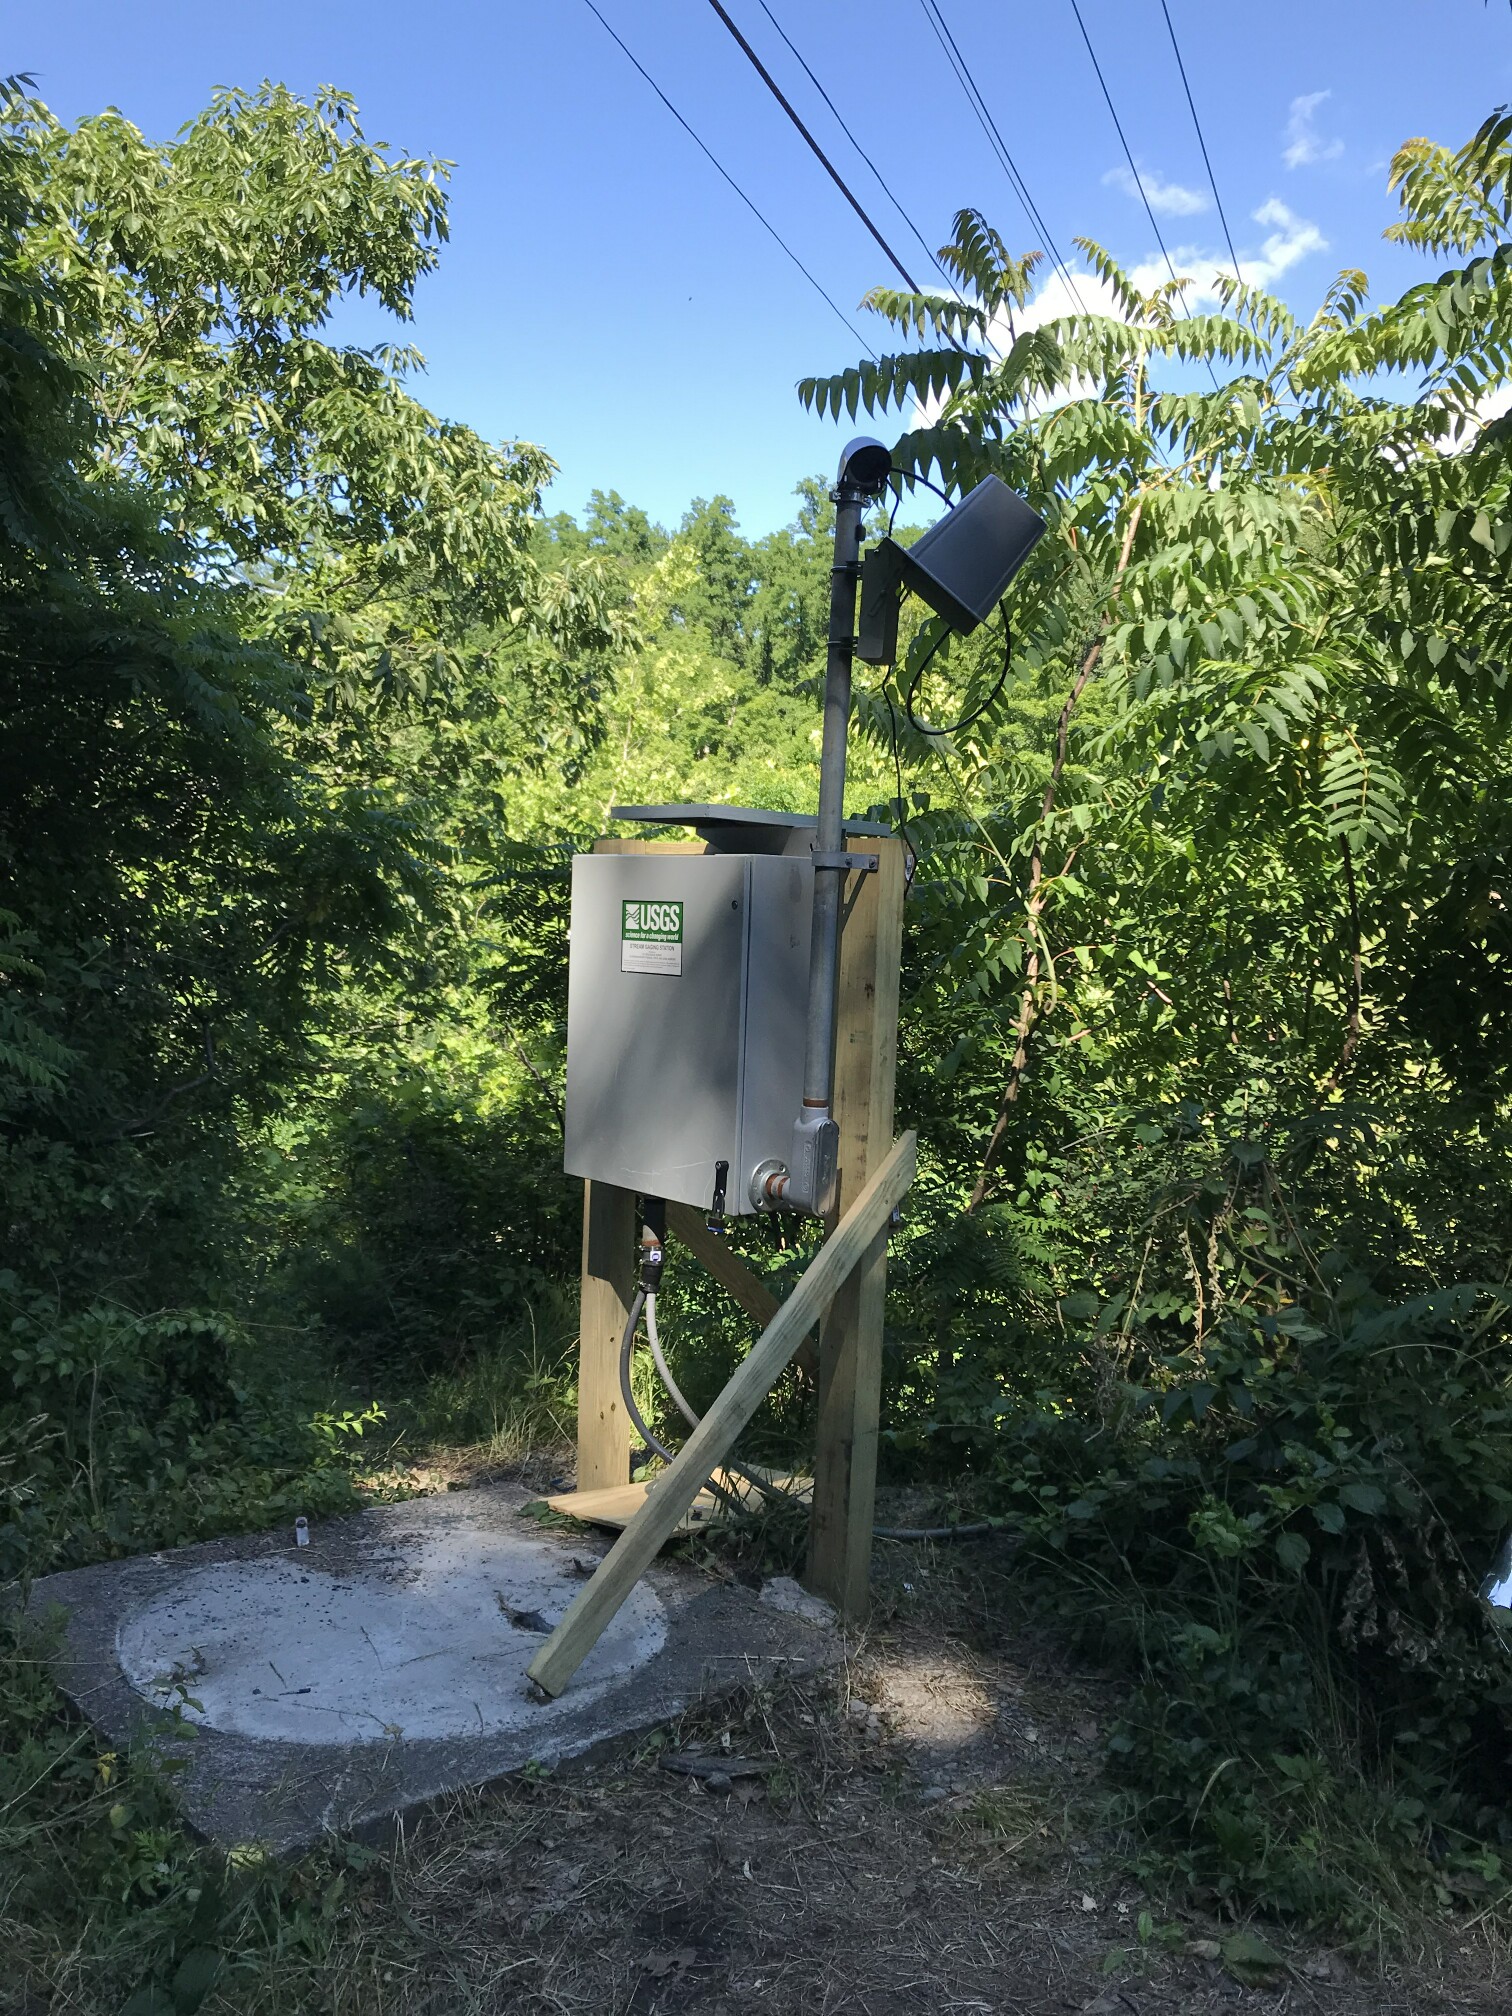 Station image
Summary of all available data for this site
Instantaneous-data availability statement

