PROVISIONAL DATA SUBJECT TO REVISION
Click to hidestation-specific text
Funding for this site is provided by:
 Site Information
LOCATION.--Lat 41°51'59", long
74°29'14" referenced to North American Datum of 1983,
Sullivan County, NY, Hydrologic Unit 02020007, on right bank
350 ft downstream from small tributary, 300 ft upstream from
bridge on East Mountain Road, 1.1 mi upstream from Sugarloaf
Brook, 1.1 mi east of Lowes Corners, and 1.5 mi southwest of
Sundown.
DRAINAGE AREA.--38.3 mi².
PERIOD OF RECORD.--February 1937 to current year.
REVISIONS HISTORY.--WSP 1702: 1952. WDR NY-90-1: Drainage area. WDR NY_00-1: 1997-99 (P). Gage height and discharge for the period Sept. 21, 2023 to Nov. 28, 2023, were revised on Feb. 27, 2024, due to the gage pool being disconnected from the main channel.
GAGE.--Water-stage recorder and crest-stage gage. Datum of gage is 874.72 ft above NGVD of 1929 and 874.68 ft above NAVD of 1988. Prior to Oct. 4, 1938, nonrecording gage at highway bridge 350 ft downstream at different datum. Oct. 4, 1938 to July 5, 1951, water-stage recorder at site 0.7 mi downstream; Oct. 4, 1938 to July 3, 1949, datum 847.00 ft above NGVD of 1929 and July 4, 1949 to July 5, 1951, datum 846.00 ft above NGVD of 1929 (levels by Board of Water Supply, City of New York). July 6, 1951 to July 31, 2001, water-stage recorder at site on left bank 250 ft upstream, at datum 874.44 ft above NGVD of 1929.
REMARKS.--Water Years 2014-23: Records fair except those for estimated daily discharges, which are poor.
EXTREMES FOR PERIOD OF RECORD.--Maximum discharge, 8,200 ft³/s, Aug. 28, 2011, gage height, 10.63 ft, outside gage height was 11.19 ft, from crest-stage gage; minimum discharge, 3.3 ft³/s, Sept. 16, 17, Oct. 17, 18, 1980.
 WaterAlert – get an
email or text (SMS) alert based on your chosen threshold.
WaterAlert – get an
email or text (SMS) alert based on your chosen threshold.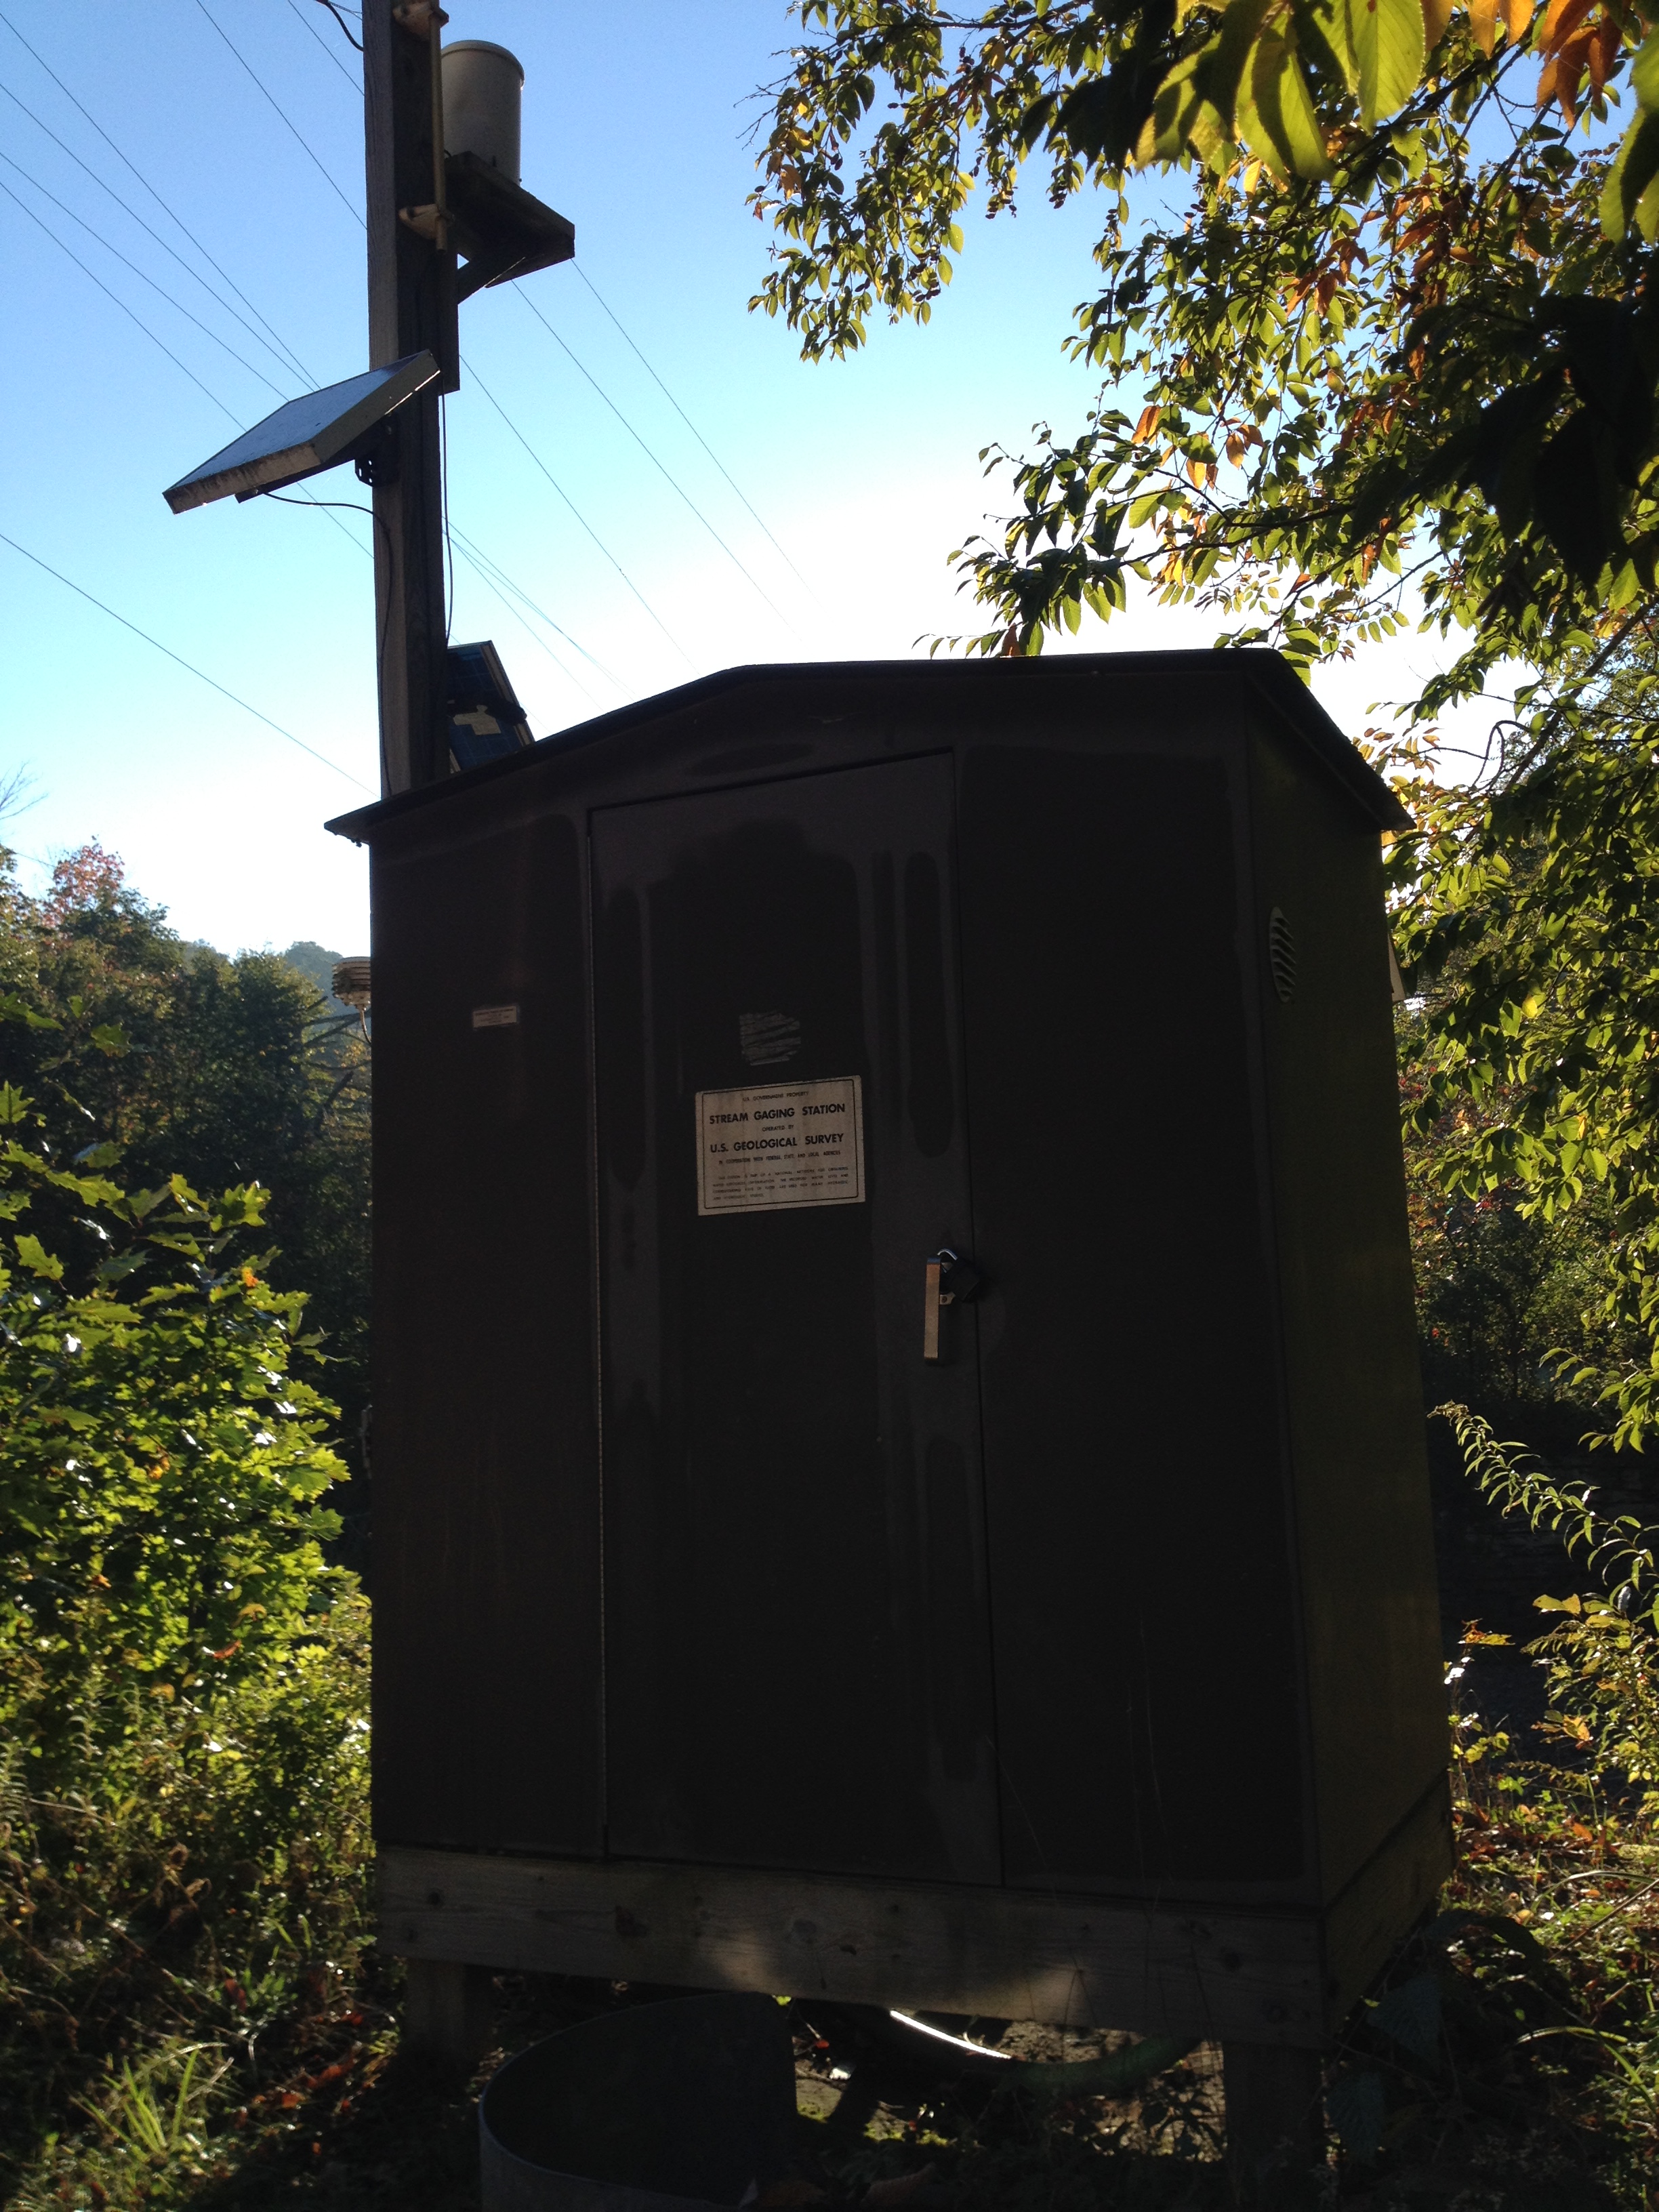 Station image
Summary of all available data for this site
Instantaneous-data availability statement

