PROVISIONAL DATA SUBJECT TO REVISION
Click to hidestation-specific text
Funding for this site is provided by:
 Site Information
LOCATION.--Lat 41°18'41.6", long
74°08'49.1" referenced to North American Datum of
1983, Orange County, NY, Hydrologic Unit 02030103, on right
bank at Mary H Harriman Memorial Park, 0.1 mi northwest of
Harriman.
DRAINAGE AREA.--10.4 mi².
PERIOD OF RECORD.--June 2020 to current year.
GAGE.--Water-stage recorder, crest-stage gage, and concrete control. Datum of gage is 522.23 ft above NAVD of 1988.
REMARKS.--Water Years 2020-23: Records good except those for estimated daily discharges, which are poor.
EXTREMES FOR PERIOD OF RECORD.--Maximum discharge, 1,100 ft³/s, Sept. 2, 2021, gage height, 6.16 ft; minimum discharge, 0.47 ft³/s, Aug. 16, 2022, gage height, 3.62 ft; minimum gage height, 3.62 ft, Aug. 12, 13, 14, 15, 16, 2022, June 11, 2023.
 WaterAlert – get an
email or text (SMS) alert based on your chosen threshold.
WaterAlert – get an
email or text (SMS) alert based on your chosen threshold.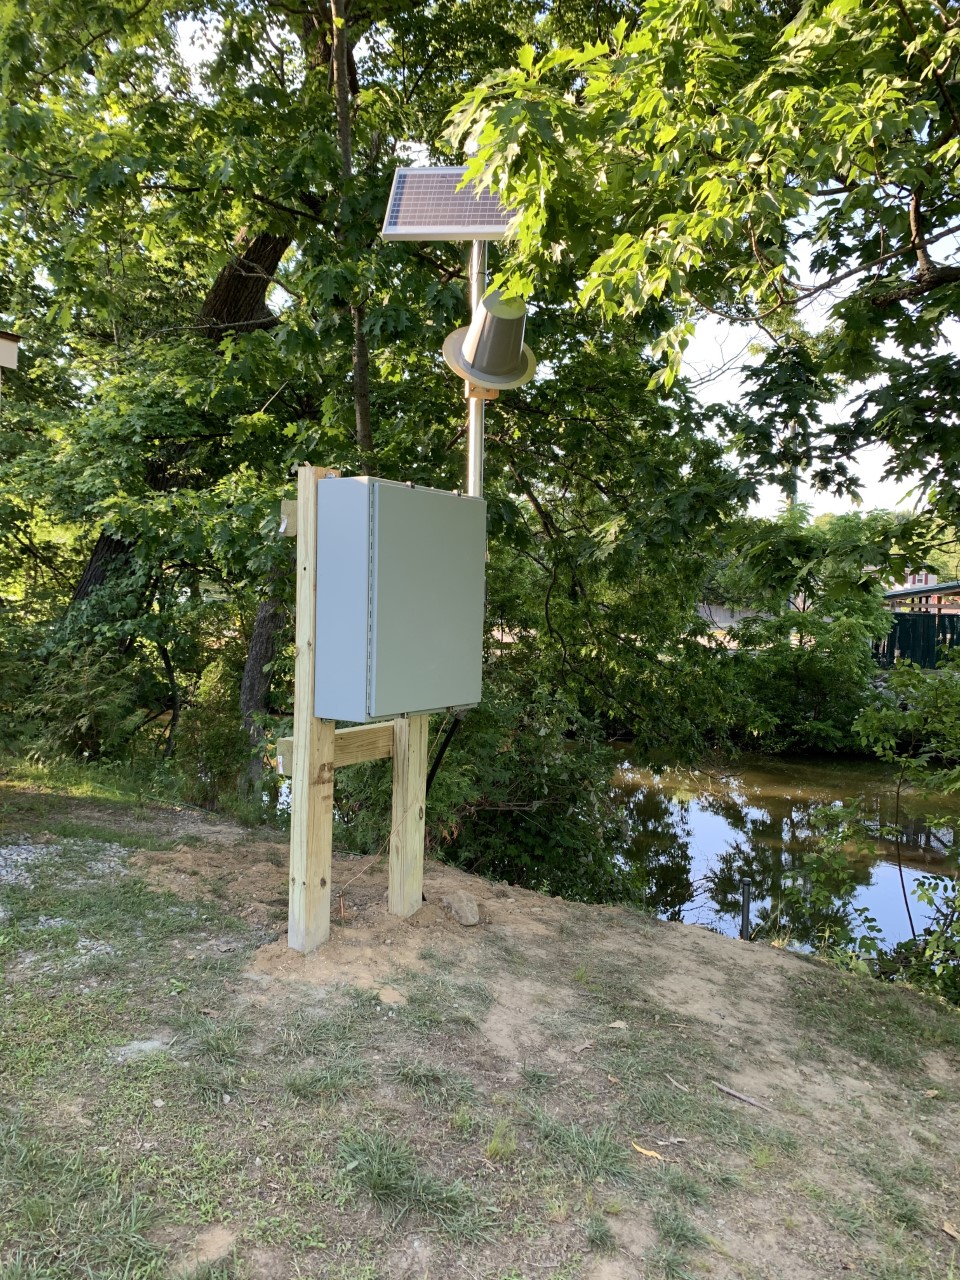 Station image
Summary of all available data for this site
Instantaneous-data availability statement

