PROVISIONAL DATA SUBJECT TO REVISION
Click to hidestation-specific text
Funding for this site is provided by:
 Site Information
-
LOCATION.--Lat 42°08'41", long 74°39'13" referenced to North American Datum of 1983, Delaware County, NY, Hydrologic Unit 02040102, on right bank at downstream side of bridge on Fair Street at intersection with Main Street at Margaretville, 0.2 mi upstream from unnamed tributary, and 1.6 mi downstream from Dry Brook.
DRAINAGE AREA.--163 mi².
PERIOD OF RECORD.--February 1937 to current year.
REVISIONS HISTORY.--WDR NY-87-1: 1948(M), 1951(P), 1953(M), 1955-56(M), 1974-75(M), 1977(M), 1978(P), 1980-81(M), 1986(M).
GAGE.--Water-stage recorder and crest-stage gage. Datum of gage is 1,302.38 ft above NGVD of 1929 and 1,301.67 ft above NAVD of 1988. Prior to Sept. 9, 1937, nonrecording gage, and Sept. 9, 1937 to Aug. 17, 1944, water-stage recorder, at same site at datum 1.00 ft higher.
REMARKS.--Water Years 2014-24: Records good except those for estimated daily discharges, which are fair.
EXTREMES FOR PERIOD OF RECORD.--Maximum discharge, 35,500 ft³/s, Aug. 28, 2011, gage height, 15.97 ft; minimum discharge, 5.0 ft³/s, Aug. 5, 1964; minimum gage height, 0.89 ft, Sept. 30, Oct. 1, 1943, present datum.
PERIOD OF DAILY RECORD1.--WATER TEMPERATURE: September 2018 to September 2024. SPECIFIC CONDUCTANCE: October 2019 to September 2024.
INSTRUMENTATION1.--Water-temperature and specific conductance satellite telemeter provides 15-minute-interval readings.
EXTREMES FOR PERIOD OF DAILY RECORD1.--WATER TEMPERATURE: Maximum, 26.0 °C, July 16, 2024; minimum, -0.1 °C, several days during winter periods. SPECIFIC CONDUCTANCE: Maximum, 193 uS/cm at 25 °C, Feb. 3, 2022, but may have been higher during periods of equipment malfunction; minimum, 30 uS/cm at 25 °C, Dec. 24, 2022, but may have been lower during periods of equipment malfunction.
1 Water-Quality Records
 WaterAlert – get an email or text (SMS) alert based on your chosen threshold.
Additional Site Information
WaterAlert – get an email or text (SMS) alert based on your chosen threshold.
Additional Site Information
Click on time-lapse image to see the latest full size video. Click on the Static Image to view the latest image For mobile devices, click this link.
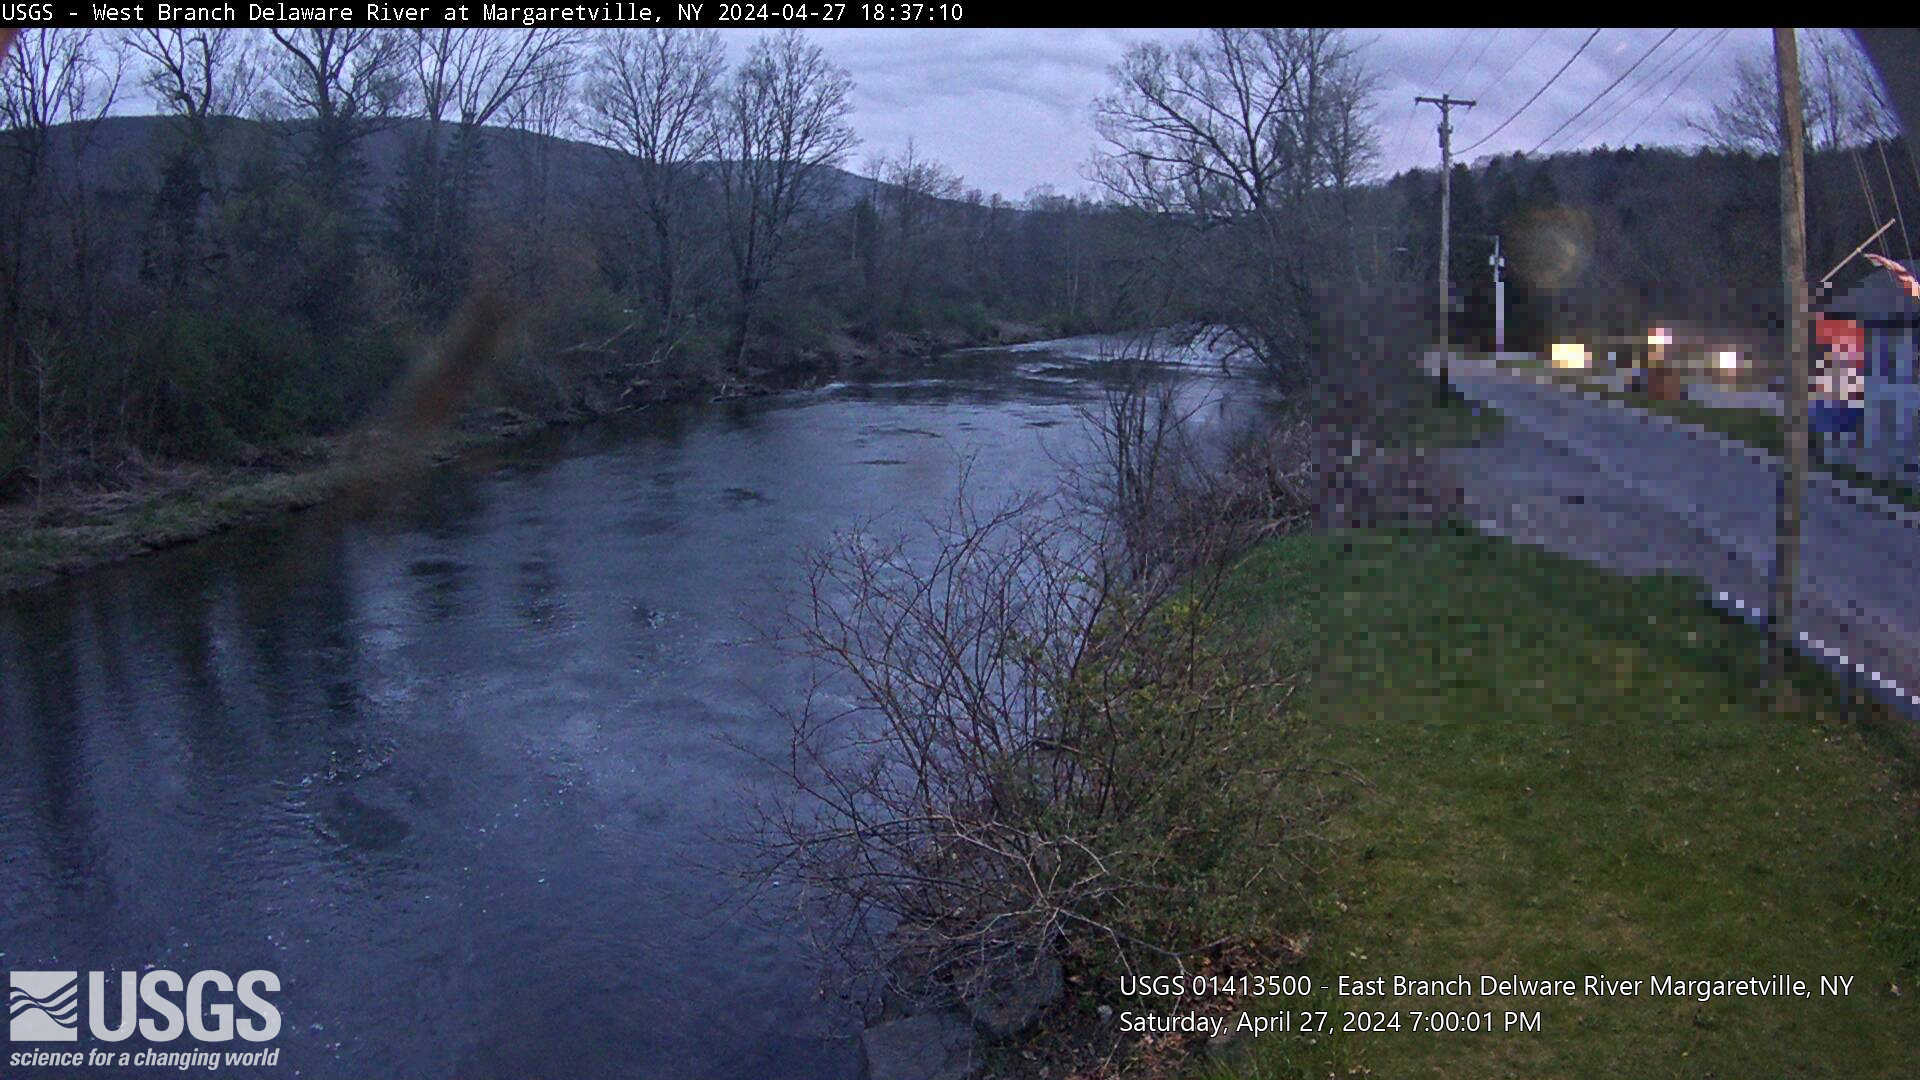 |
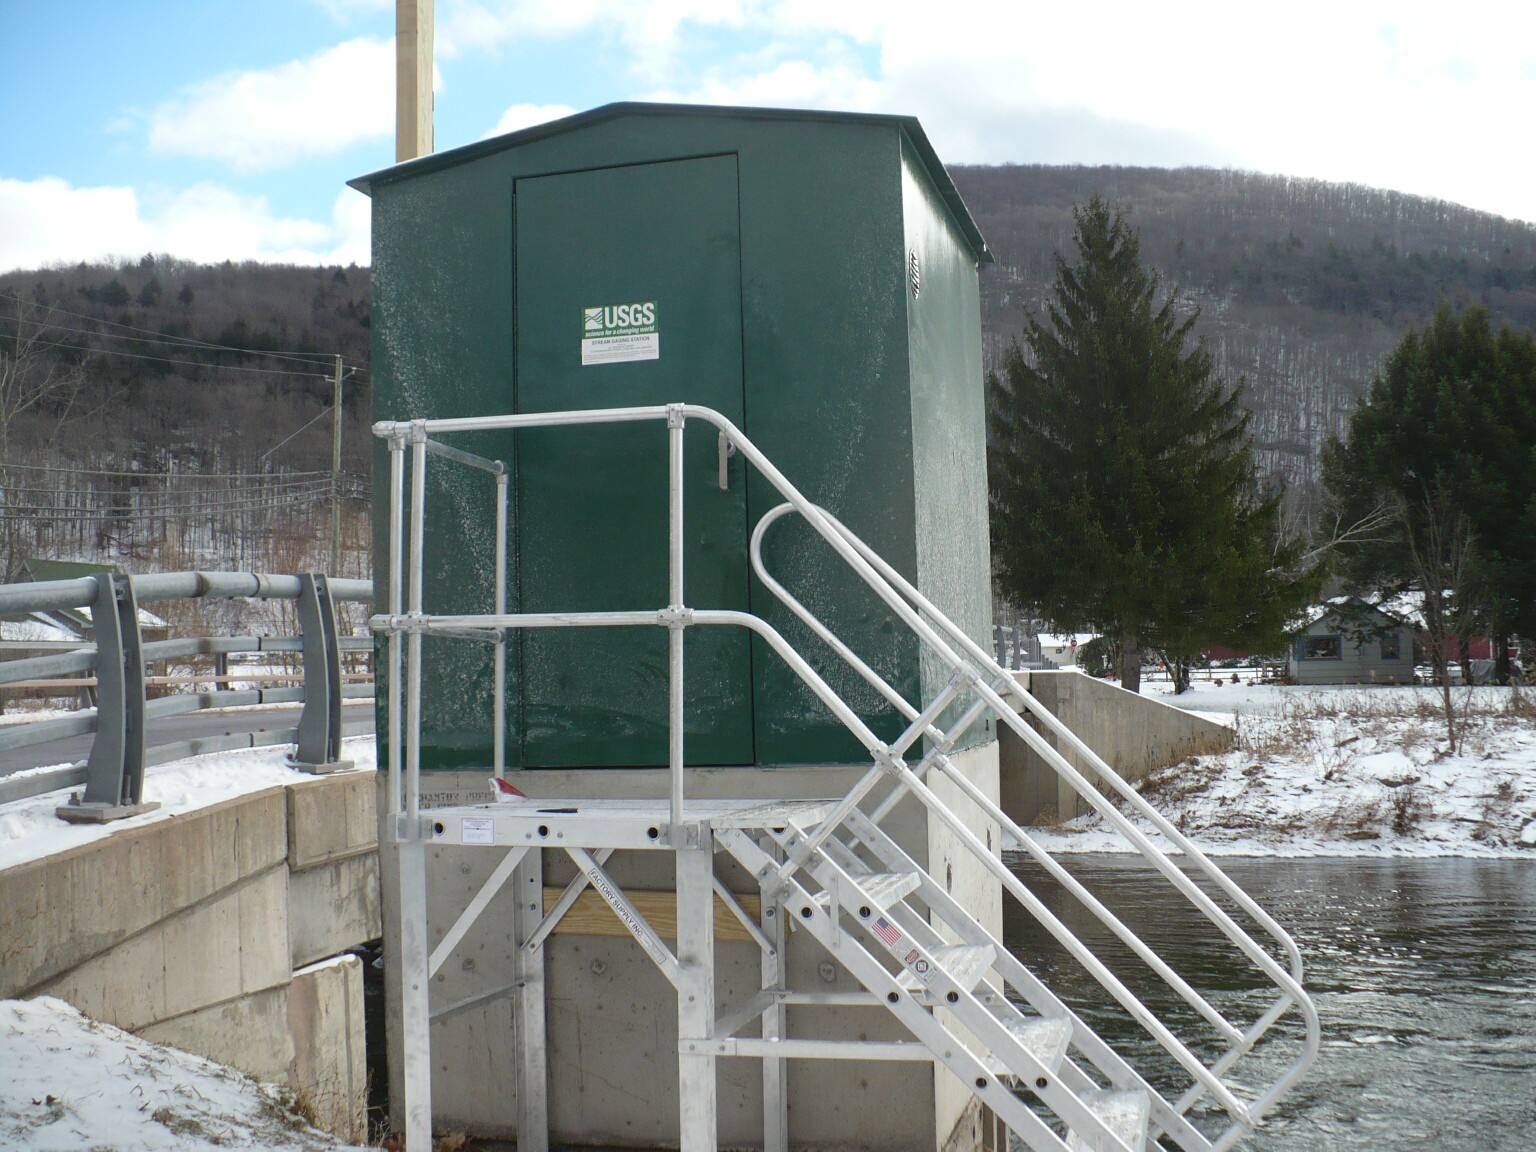 Station image
Summary of all available data for this site
Instantaneous-data availability statement

