PROVISIONAL DATA SUBJECT TO REVISION
Click to hidestation-specific text
 Site Information
LOCATION.--Lat 42°10'21.6", long
75°07'18.9" referenced to North American Datum of
1983, Delaware County, NY, Hydrologic Unit 02040101, on right
bank 150 ft downstream from East Street, in Walton, and 0.55 mi
upstream from mouth (at West Branch Delaware River).
DRAINAGE AREA.--24.7 mi².
PERIOD OF RECORD.--October 1998 to September 2013, December 2017 to current year.
REVISIONS HISTORY.--Datum of gage was revised on Sept. 19, 2022, from 1,221.48 ft above NGVD of 1929 (Federal Emergency Management Agency flood-insurance study reference mark) to 1,219.53 ft above NGVD of 1929 and from 1,221.05 ft above NAVD of 1988 (VERTCON) to 1,219.09 ft above NAVD of 1988, due to an error with the datum establishment using reference mark.
GAGE.--Water-stage recorder and crest-stage gage. Datum of gage is 1,219.53 ft above NGVD of 1929 and 1,219.09 ft above NAVD of 1988.
REMARKS.--Water Years 2018-20: Records good except those for estimated daily discharges, which are poor. Water Years 2021-23: Records fair except those for estimated daily discharges, which are poor.
EXTREMES FOR PERIOD OF RECORD.--Maximum discharge, 7,110 ft³/s, June 28, 2006, gage height, 9.95 ft, outside gage height was 10.28 ft, from crest-stage gage, from rating curve extended above 2,600 ft³/s; minimum discharge, 0.83 ft³/s, Sept. 23, 2010, result of unknown regulation; minimum gage height, 1.37 ft, Aug. 30, 31, 2001.
 WaterAlert – get an
email or text (SMS) alert based on your chosen threshold.
WaterAlert – get an
email or text (SMS) alert based on your chosen threshold.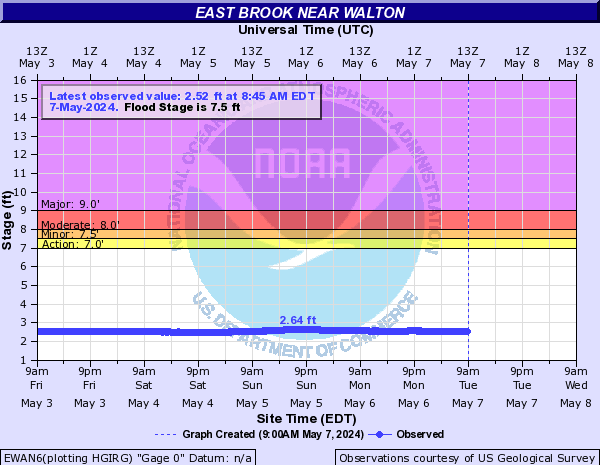
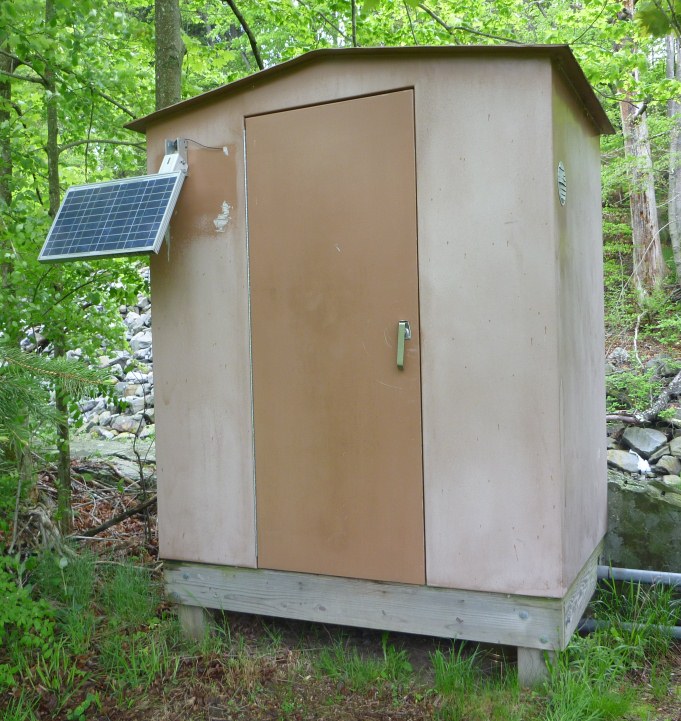 Station image
Summary of all available data for this site
Instantaneous-data availability statement

