PROVISIONAL DATA SUBJECT TO REVISION
Click to hidestation-specific text
Funding for this site is provided by:
 Site Information
LOCATION.--Lat 41°49'40.4", long
74°38'20.1" referenced to North American Datum of
1983, Sullivan County, NY, Hydrologic Unit 02040104, at a
gatehouse at Neversink Dam on Neversink River, and 2 mi
southwest of Neversink.
DRAINAGE AREA.--92.5 mi².
PERIOD OF RECORD.--June 1953 to September 2013 (furnished month-end elevations, contents, and diversions), October 2013 to current year (furnished daily observation elevations in NGVD of 1929), October 2019 to current year (continuously recorded elevations in NAVD of 1988).
REVISIONS HISTORY.--WDR NY-85-1: Drainage area. WDR NY-82-1: 1976 and 1977-Diversion.
GAGE.--Water-stage recorder. Datum of gage is NAVD of 1988. Datum of furnished elevations is NGVD of 1929 (levels by Board of Water Supply, City of New York).
COOPERATION.--Daily observation records of elevation and capacity table provided by New York City Department of Environmental Protection.
REMARKS.--Reservoir is formed by an earthfill rockfaced dam. Storage began June 2, 1953. Usable capacity 34,941 mil gal between minimum operating level, elevation 1,319.0 ft, NGVD of 1929, and crest of spillway, elevation 1,440.0 ft, NGVD of 1929. Capacity at crest of spillway 37,146 mil gal; at minimum operating level, 2,205 mil gal; dead storage below diversion sill and outlet sill, elevation 1,314.0 ft, NGVD of 1929, 1,680 mil gal. Figures given herein represent total contents. Reservoir impounds water for diversion (01435800) through Neversink-Grahamsville Tunnel to Rondout Reservoir on Rondout Creek, in Hudson River basin, for water supply of City of New York; for release during periods of low flow in the lower Delaware River basin, as directed by the Delaware River Master; and for conservation release. No diversion prior to Dec. 3, 1953.
EXTREMES FOR PERIOD OF RECORD.--Maximum contents observed, 38,983 mil gal, Apr. 3, 2005, elevation, 1,443.66 ft, NGVD of 1929; minimum contents observed (after first filling), 1,985 mil gal, Nov. 25, 1964, elevation, 1,316.98 ft, NGVD of 1929. Maximum elevation since October 2019, 1,441.16 ft, NAVD of 1988, Apr. 13, 2020; minimum elevation since October 2019, 1,416.46 ft, NAVD of 1988, Sept. 5, 2022.
PERIOD OF DAILY RECORD1.--WATER TEMPERATURE AT 1,355 FT ABOVE NAVD OF 1988: October 2019 to current year. WATER TEMPERATURE AT 1,383 FT ABOVE NAVD OF 1988: October 2019 to current year. WATER TEMPERATURE AT 1,425 FT ABOVE NAVD OF 1988: October 2019 to current year.
INSTRUMENTATION1.--Water-temperature recorder provides 15-minute-interval readings.
REMARKS1.--Interruption of record may occur due to water levels falling below the elevation of the sensor.
EXTREMES FOR PERIOD OF DAILY RECORD1.--WATER TEMPERATURE AT 1,355 FT ABOVE NAVD OF 1988: Maximum, 12.8 °C, Nov. 1, 2019, Oct. 20, 2021; minimum, 1.6 °C, Mar. 1, 2020, Jan. 30, Feb. 3, 4, 8, 2021. WATER TEMPERATURE AT 1,383 FT ABOVE NAVD OF 1988: Maximum, 20.3 °C, Sept. 22, 23, 2022; minimum, 1.4 °C, Jan. 30, 2021. WATER TEMPERATURE AT 1,425 FT ABOVE NAVD OF 1988: Maximum, 28.4 °C, July 23, 2022; minimum, 0.5 °C, Feb. 29, Mar. 1, 2020.
1 Water-Quality Records
DRAINAGE AREA.--92.5 mi².
PERIOD OF RECORD.--June 1953 to September 2013 (furnished month-end elevations, contents, and diversions), October 2013 to current year (furnished daily observation elevations in NGVD of 1929), October 2019 to current year (continuously recorded elevations in NAVD of 1988).
REVISIONS HISTORY.--WDR NY-85-1: Drainage area. WDR NY-82-1: 1976 and 1977-Diversion.
GAGE.--Water-stage recorder. Datum of gage is NAVD of 1988. Datum of furnished elevations is NGVD of 1929 (levels by Board of Water Supply, City of New York).
COOPERATION.--Daily observation records of elevation and capacity table provided by New York City Department of Environmental Protection.
REMARKS.--Reservoir is formed by an earthfill rockfaced dam. Storage began June 2, 1953. Usable capacity 34,941 mil gal between minimum operating level, elevation 1,319.0 ft, NGVD of 1929, and crest of spillway, elevation 1,440.0 ft, NGVD of 1929. Capacity at crest of spillway 37,146 mil gal; at minimum operating level, 2,205 mil gal; dead storage below diversion sill and outlet sill, elevation 1,314.0 ft, NGVD of 1929, 1,680 mil gal. Figures given herein represent total contents. Reservoir impounds water for diversion (01435800) through Neversink-Grahamsville Tunnel to Rondout Reservoir on Rondout Creek, in Hudson River basin, for water supply of City of New York; for release during periods of low flow in the lower Delaware River basin, as directed by the Delaware River Master; and for conservation release. No diversion prior to Dec. 3, 1953.
Capacity table (elevation, in NGVD of 1929, in feet, and total contents, in millions of gallons)

Elevation  Contents      Elevation  Contents
1,314.0     1,680        1,390.0     17,011
1,330.0     3,544        1,410.0     24,023
1,350.0     6,901        1,430.0     32,400
1,370.0    11,370        1,445.0     39,666
EXTREMES FOR PERIOD OF RECORD.--Maximum contents observed, 38,983 mil gal, Apr. 3, 2005, elevation, 1,443.66 ft, NGVD of 1929; minimum contents observed (after first filling), 1,985 mil gal, Nov. 25, 1964, elevation, 1,316.98 ft, NGVD of 1929. Maximum elevation since October 2019, 1,441.16 ft, NAVD of 1988, Apr. 13, 2020; minimum elevation since October 2019, 1,416.46 ft, NAVD of 1988, Sept. 5, 2022.
PERIOD OF DAILY RECORD1.--WATER TEMPERATURE AT 1,355 FT ABOVE NAVD OF 1988: October 2019 to current year. WATER TEMPERATURE AT 1,383 FT ABOVE NAVD OF 1988: October 2019 to current year. WATER TEMPERATURE AT 1,425 FT ABOVE NAVD OF 1988: October 2019 to current year.
INSTRUMENTATION1.--Water-temperature recorder provides 15-minute-interval readings.
REMARKS1.--Interruption of record may occur due to water levels falling below the elevation of the sensor.
EXTREMES FOR PERIOD OF DAILY RECORD1.--WATER TEMPERATURE AT 1,355 FT ABOVE NAVD OF 1988: Maximum, 12.8 °C, Nov. 1, 2019, Oct. 20, 2021; minimum, 1.6 °C, Mar. 1, 2020, Jan. 30, Feb. 3, 4, 8, 2021. WATER TEMPERATURE AT 1,383 FT ABOVE NAVD OF 1988: Maximum, 20.3 °C, Sept. 22, 23, 2022; minimum, 1.4 °C, Jan. 30, 2021. WATER TEMPERATURE AT 1,425 FT ABOVE NAVD OF 1988: Maximum, 28.4 °C, July 23, 2022; minimum, 0.5 °C, Feb. 29, Mar. 1, 2020.
1 Water-Quality Records
 WaterAlert – get an
email or text (SMS) alert based on your chosen threshold. Additional Site
Information
WaterAlert – get an
email or text (SMS) alert based on your chosen threshold. Additional Site
Information
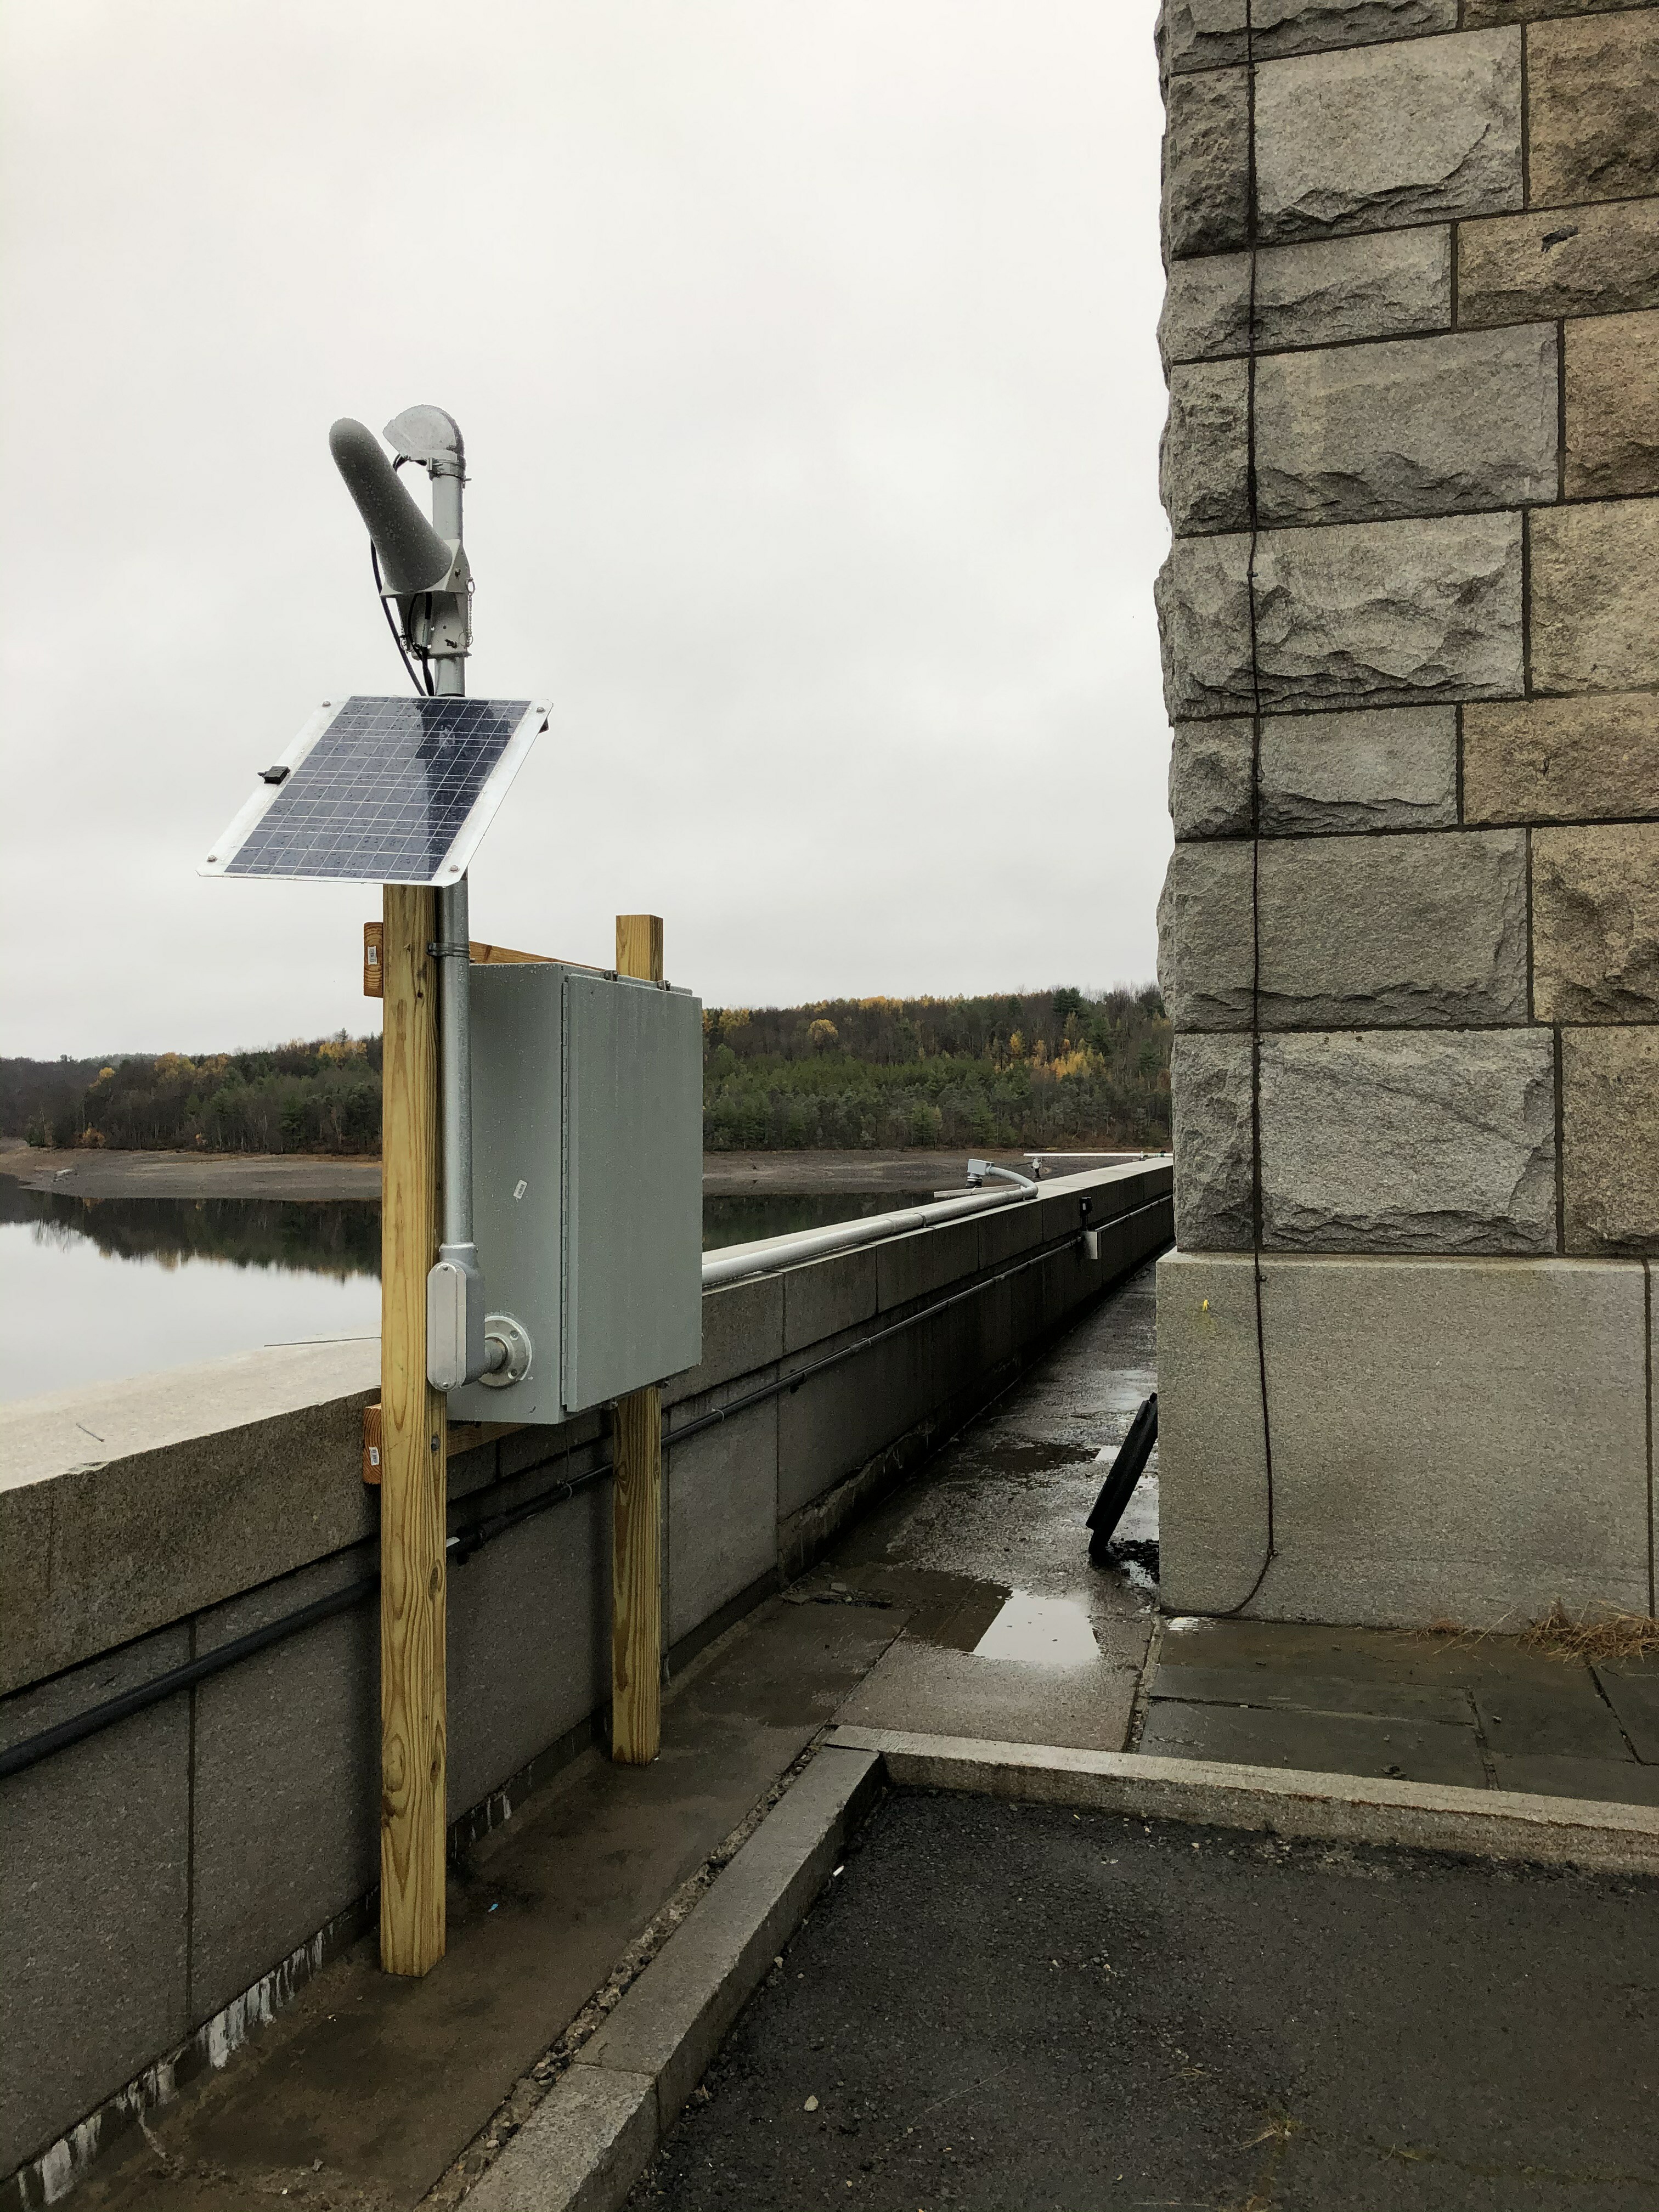 Station image
Summary of all available data for this site
Instantaneous-data availability statement

