PROVISIONAL DATA SUBJECT TO REVISION
Click to hidestation-specific text
Funding for this site is provided by:
 Site Information
LOCATION.--Lat 42°23'45", long
77°42'41" referenced to North American Datum of 1983,
Steuben County, NY, Hydrologic Unit 02050104, on left bank 0.2
mi downstream from Arkport Dam, and 0.9 mi west of
Arkport.
DRAINAGE AREA.--30.6 mi².
PERIOD OF RECORD.--January 1937 to current year.
REVISIONS HISTORY.--WSP 1552: 1952-57. WSP 2103: Drainage area. 2009 (M). Discharge for the periods Mar. 3, 4, Apr. 26, 30, May 1, 15, 16, Dec. 25, 2020, were revised on May 19, 2021, based on changes to the stage-discharge rating.
GAGE.--Water-stage recorder and concrete control. Datum of gage is 1,202.85 ft above NGVD of 1929 and 1,202.66 ft above NAVD of 1988.
REMARKS.--Since March 1940, flows above 500 ft³/s controlled by detention in Arkport Reservoir (station 01521000).
Water Years 2014-15: Records good except those for estimated daily discharges, which are fair.
Water Years 2016-23: Records good except those for estimated daily discharges, which are poor.
EXTREMES FOR PERIOD OF RECORD.--Maximum discharge, since construction of Arkport Reservoir in 1940, 1,740 ft³/s, Feb. 11, 1966, gage height, 4.17 ft; maximum gage height, 5.61 ft, Jan. 26, 1978 (ice jam); minimum discharge not determined.
EXTREMES OUTSIDE PERIOD OF RECORD.--Flood of July 8, 1935, reached a discharge of 4,820 ft³/s, on basis of slope-area measurement of peak flow.
EXTREMES FOR PERIOD PRIOR TO REGULATION.--Maximum discharge, prior to construction of Arkport Reservoir in 1940, 2,000 ft³/s, Mar. 5, 1938, Feb. 20, 1939; maximum gage height, 5.63 ft, Feb.19, 1939 (ice jam); practically no flow July 30, 1938, Sept. 30, 1939 (result of construction operations).
 WaterAlert – get an
email or text (SMS) alert based on your chosen threshold.
WaterAlert – get an
email or text (SMS) alert based on your chosen threshold.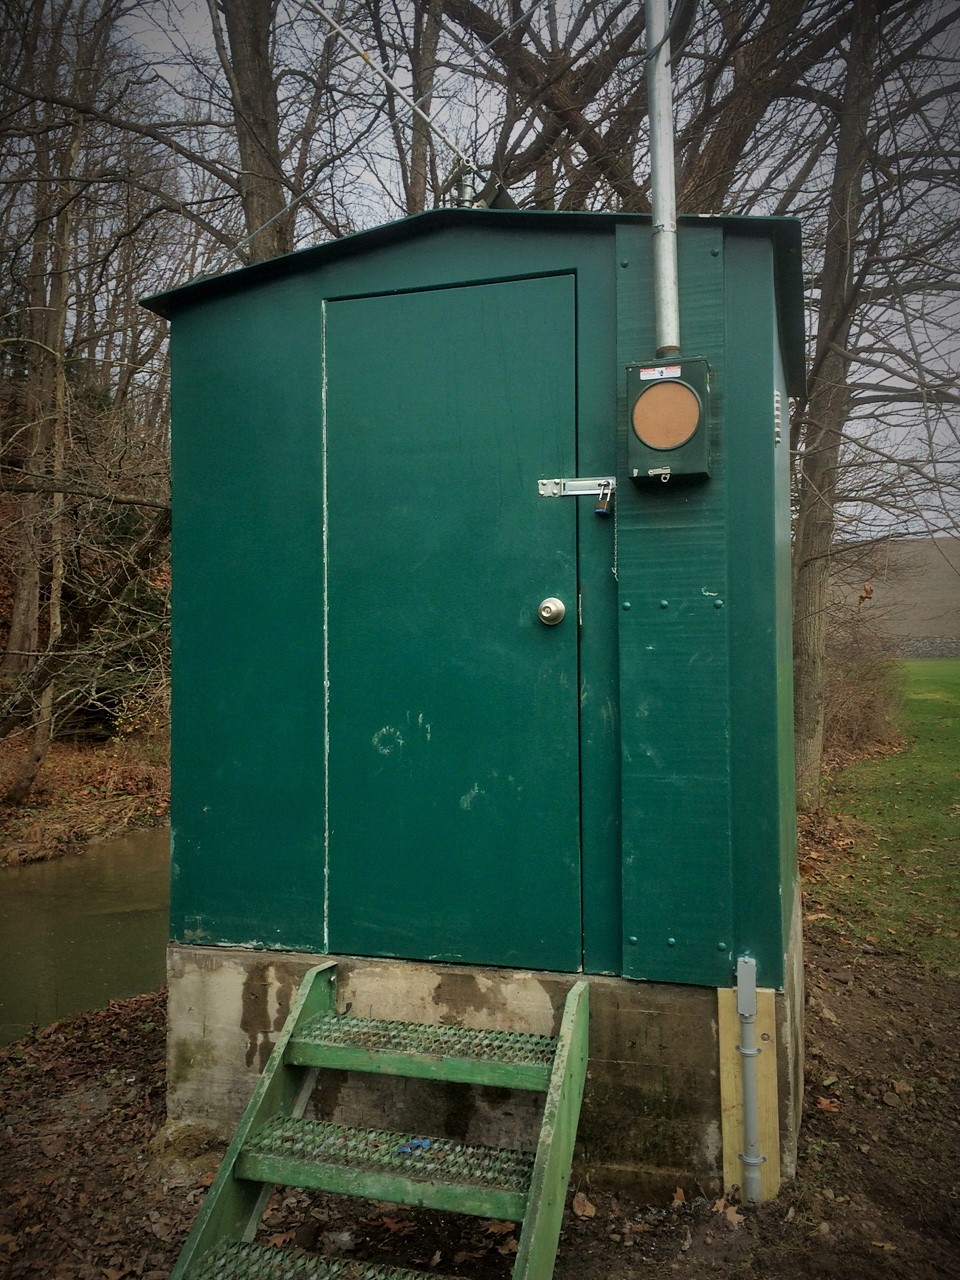 Station image
Summary of all available data for this site
Instantaneous-data availability statement

