PROVISIONAL DATA SUBJECT TO REVISION
Click to hidestation-specific text
Funding for this site is provided by:
 Site Information
LOCATION.--Lat 43°10'28.9", long
78°41'20.6" referenced to North American Datum of
1983, Niagara County, NY, Hydrologic Unit 04130001, on left
bank adjacent to floodwall, in Lockport, 880 ft upstream of
Halls Waste Weir, and 1,140 ft upstream from Mill Street Lift
Bridge.
DRAINAGE AREA.--See REMARKS.
PERIOD OF RECORD.--March 2021 to current year (navigation seasons only).
REVISIONS HISTORY.--Specific conductance records for the period Aug. 16, to Dec. 1, 2022, were revised on Jan. 3, 2023, a calibration error was discovered which changed the required data correction.
GAGE.--Acoustic velocity meter, water-stage recorder, and crest-stage gage. Datum of gage is 502.10 ft above NAVD of 1988.
REMARKS.--This record represents net diversion from Niagara River basin into Genesee and Oswego River basin through Erie (Barge) Canal. Water Years 2021-22: Records fair except those for estimated daily discharges and discharges below 200 ft³/s, which are poor.
PERIOD OF RECORD1.--May 2021 to current year (navigation seasons only).
PERIOD OF DAILY RECORD1.--WATER TEMPERATURE: May 2021 to current year (navigation seasons only).
SPECIFIC CONDUCTANCE: May 2021 to current year (navigation seasons only).
DISSOLVED OXYGEN: May 2021 to current year (navigation seasons only).
TURBIDITY: May 2021 to current year (navigation seasons only).
INSTRUMENTATION1.--A multi-parameter water-quality sonde measures water temperature, specific conductance, dissolved oxygen, and turbidity at 15-minute intervals since May 2021.
COOPERATION1.--In cooperation with NYS Thruway Authority, Office of Canals.
EXTREMES FOR PERIOD OF DAILY RECORD1.--WATER TEMPERATURE: Maximum, 26.9°C, Aug. 29, 30, 2021; minimum, 1.8°C, Nov. 23, 2022.
SPECIFIC CONDUCTANCE: Maximum, 921 uS/cm @ 25°C, June 3, 2022; minimum, 220 uS/cm @ 25°C, July 22, 2021.
DISSOLVED OXYGEN: Maximum, 15.4 mg/L, July, 15, 2023; minimum, 5.5 mg/L, July 23, 2021.
TURBIDITY: Maximum, 216 FNU, Nov. 15, 2022; minimum, 3 FNU, Oct. 11, Dec. 2, 2023.
1 Water-Quality Records
 WaterAlert – get an
email or text (SMS) alert based on your chosen threshold.
WaterAlert – get an
email or text (SMS) alert based on your chosen threshold.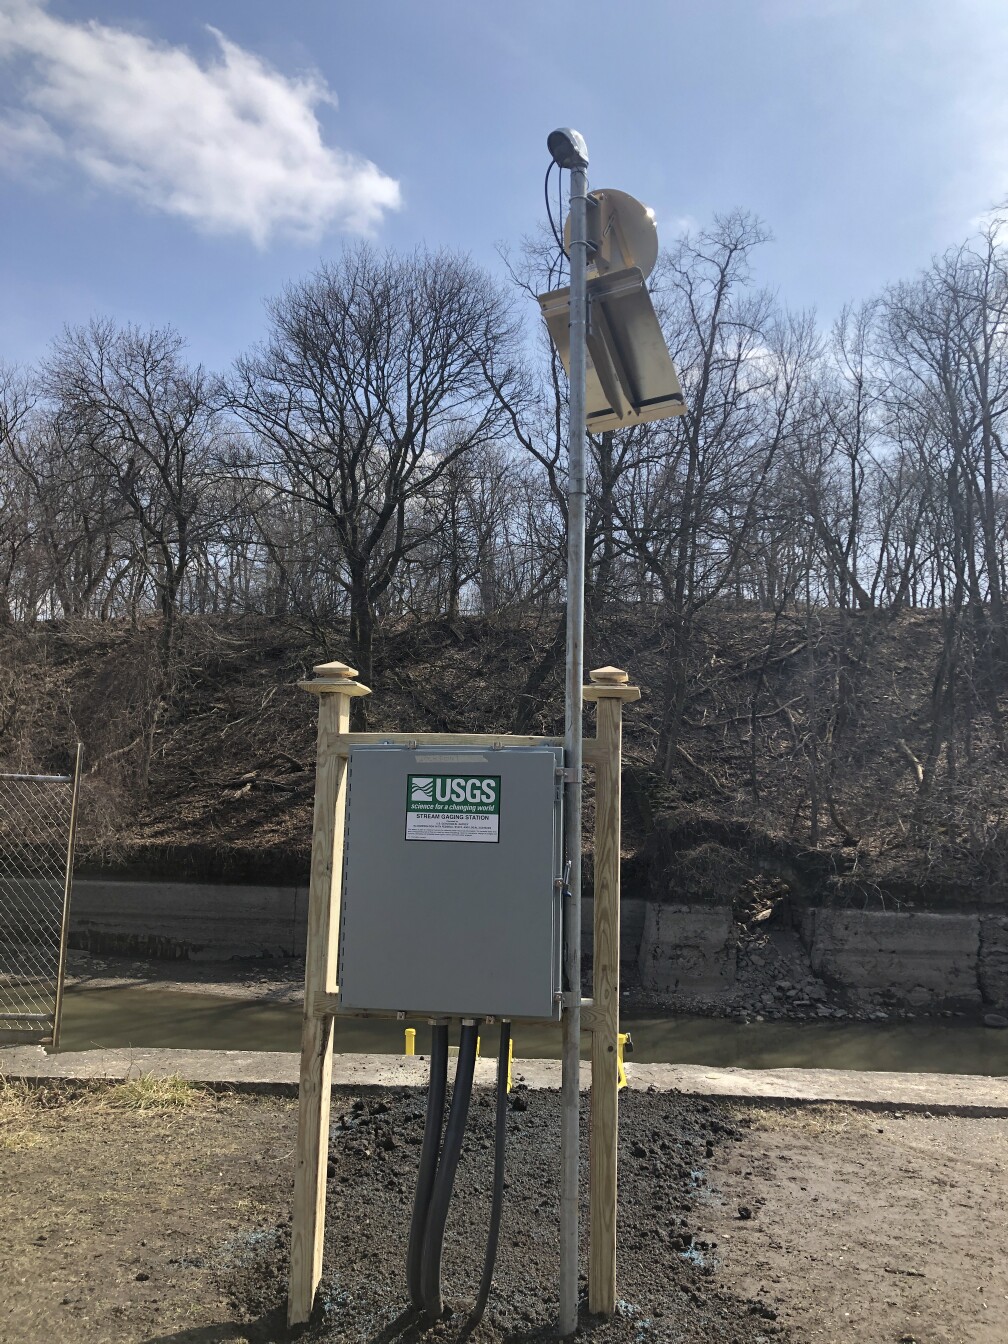 Station image
Summary of all available data for this site
Instantaneous-data availability statement