PROVISIONAL DATA SUBJECT TO REVISION
Click to hidestation-specific text
Funding for this site is provided by:
 Site Information
LOCATION.--Lat 43°21'39.0", long
78°15'52.3" referenced to North American Datum of
1983, Orleans County, NY, Hydrologic Unit 04130001, at right
bank on downstream side of bridge on Roosevelt Highway (Route
18), 10.6 mi downstream from dam at Lyndonville, 1.4 mi
upstream from mouth into Lake Ontario, and 6.9 mi northeast of
Lyndonville.
DRAINAGE AREA.--107 mi².
PERIOD OF RECORD.--Miscellaneous measurements--2015-18, September 2020 to current year.
GAGE.--Acoustic velocity meter, water-stage recorder, and crest-stage gage. Datum of gage is 235.45 ft above NAVD of 1988 and 235.38 ft above IGLD of 1985.
REMARKS.--Flow slightly regulated by Lyndonville Dam 10.6 mi upstream from station. Flow occasionally reversed as a result of seiche from Lake Ontario and wind affect. Discharge includes undetermined diversion from Erie (Barge) Canal upstream from station. Water Years 2020-23: Records fair except those for estimated daily discharges and discharges below 25 ft³/s, which are poor.
EXTREMES FOR PERIOD OF RECORD.--Maximum discharge, 2,270 ft³/s, Feb. 18, 2022, gage height, 16.18 ft; maximum gage height, 16.22 ft, Feb. 18, 2022; minimum daily discharge, -0.13 ft³/s, Aug. 16, 2022; minimum gage height, 8.70 ft, Oct. 12, 13, 2022.
PERIOD OF DAILY RECORD1.--WATER TEMPERATURE: October 2020 to current year. DISSOLVED OXYGEN: October 2020 to current year. TURBIDITY: October 2020 to current year. SPECIFIC CONDUCTANCE: October 2020 to current year.
INSTRUMENTATION1.--A continuous water-quality monitor with water temperature, specific conductance, dissolved oxygen, and turbidity provides 15-minute-interval readings.
EXTREMES FOR PERIOD OF DAILY RECORD1.--SPECIFIC CONDUCTANCE: Maximum, 1,090 uS/cm at 25 °C, Feb. 14, 2021; minimum, 210 uS/cm at 25 °C, Aug. 16, 2023. WATER TEMPERATURE: Maximum, 29.7 °C, June 29, 2021; minimum, -0.1 °C on many days during the winter periods. DISSOLVED OXYGEN: Maximum, 16.1 mg/L, Nov. 29, 2023; minimum, 3.1 mg/L, June 30, 2021. TURBIDITY: Maximum, 1,250 FNU, July 29, 2023; minimum, 0.9 FNU, Oct. 8, 2023.
1 Water-Quality Records
 WaterAlert – get an
email or text (SMS) alert based on your chosen threshold.
WaterAlert – get an
email or text (SMS) alert based on your chosen threshold.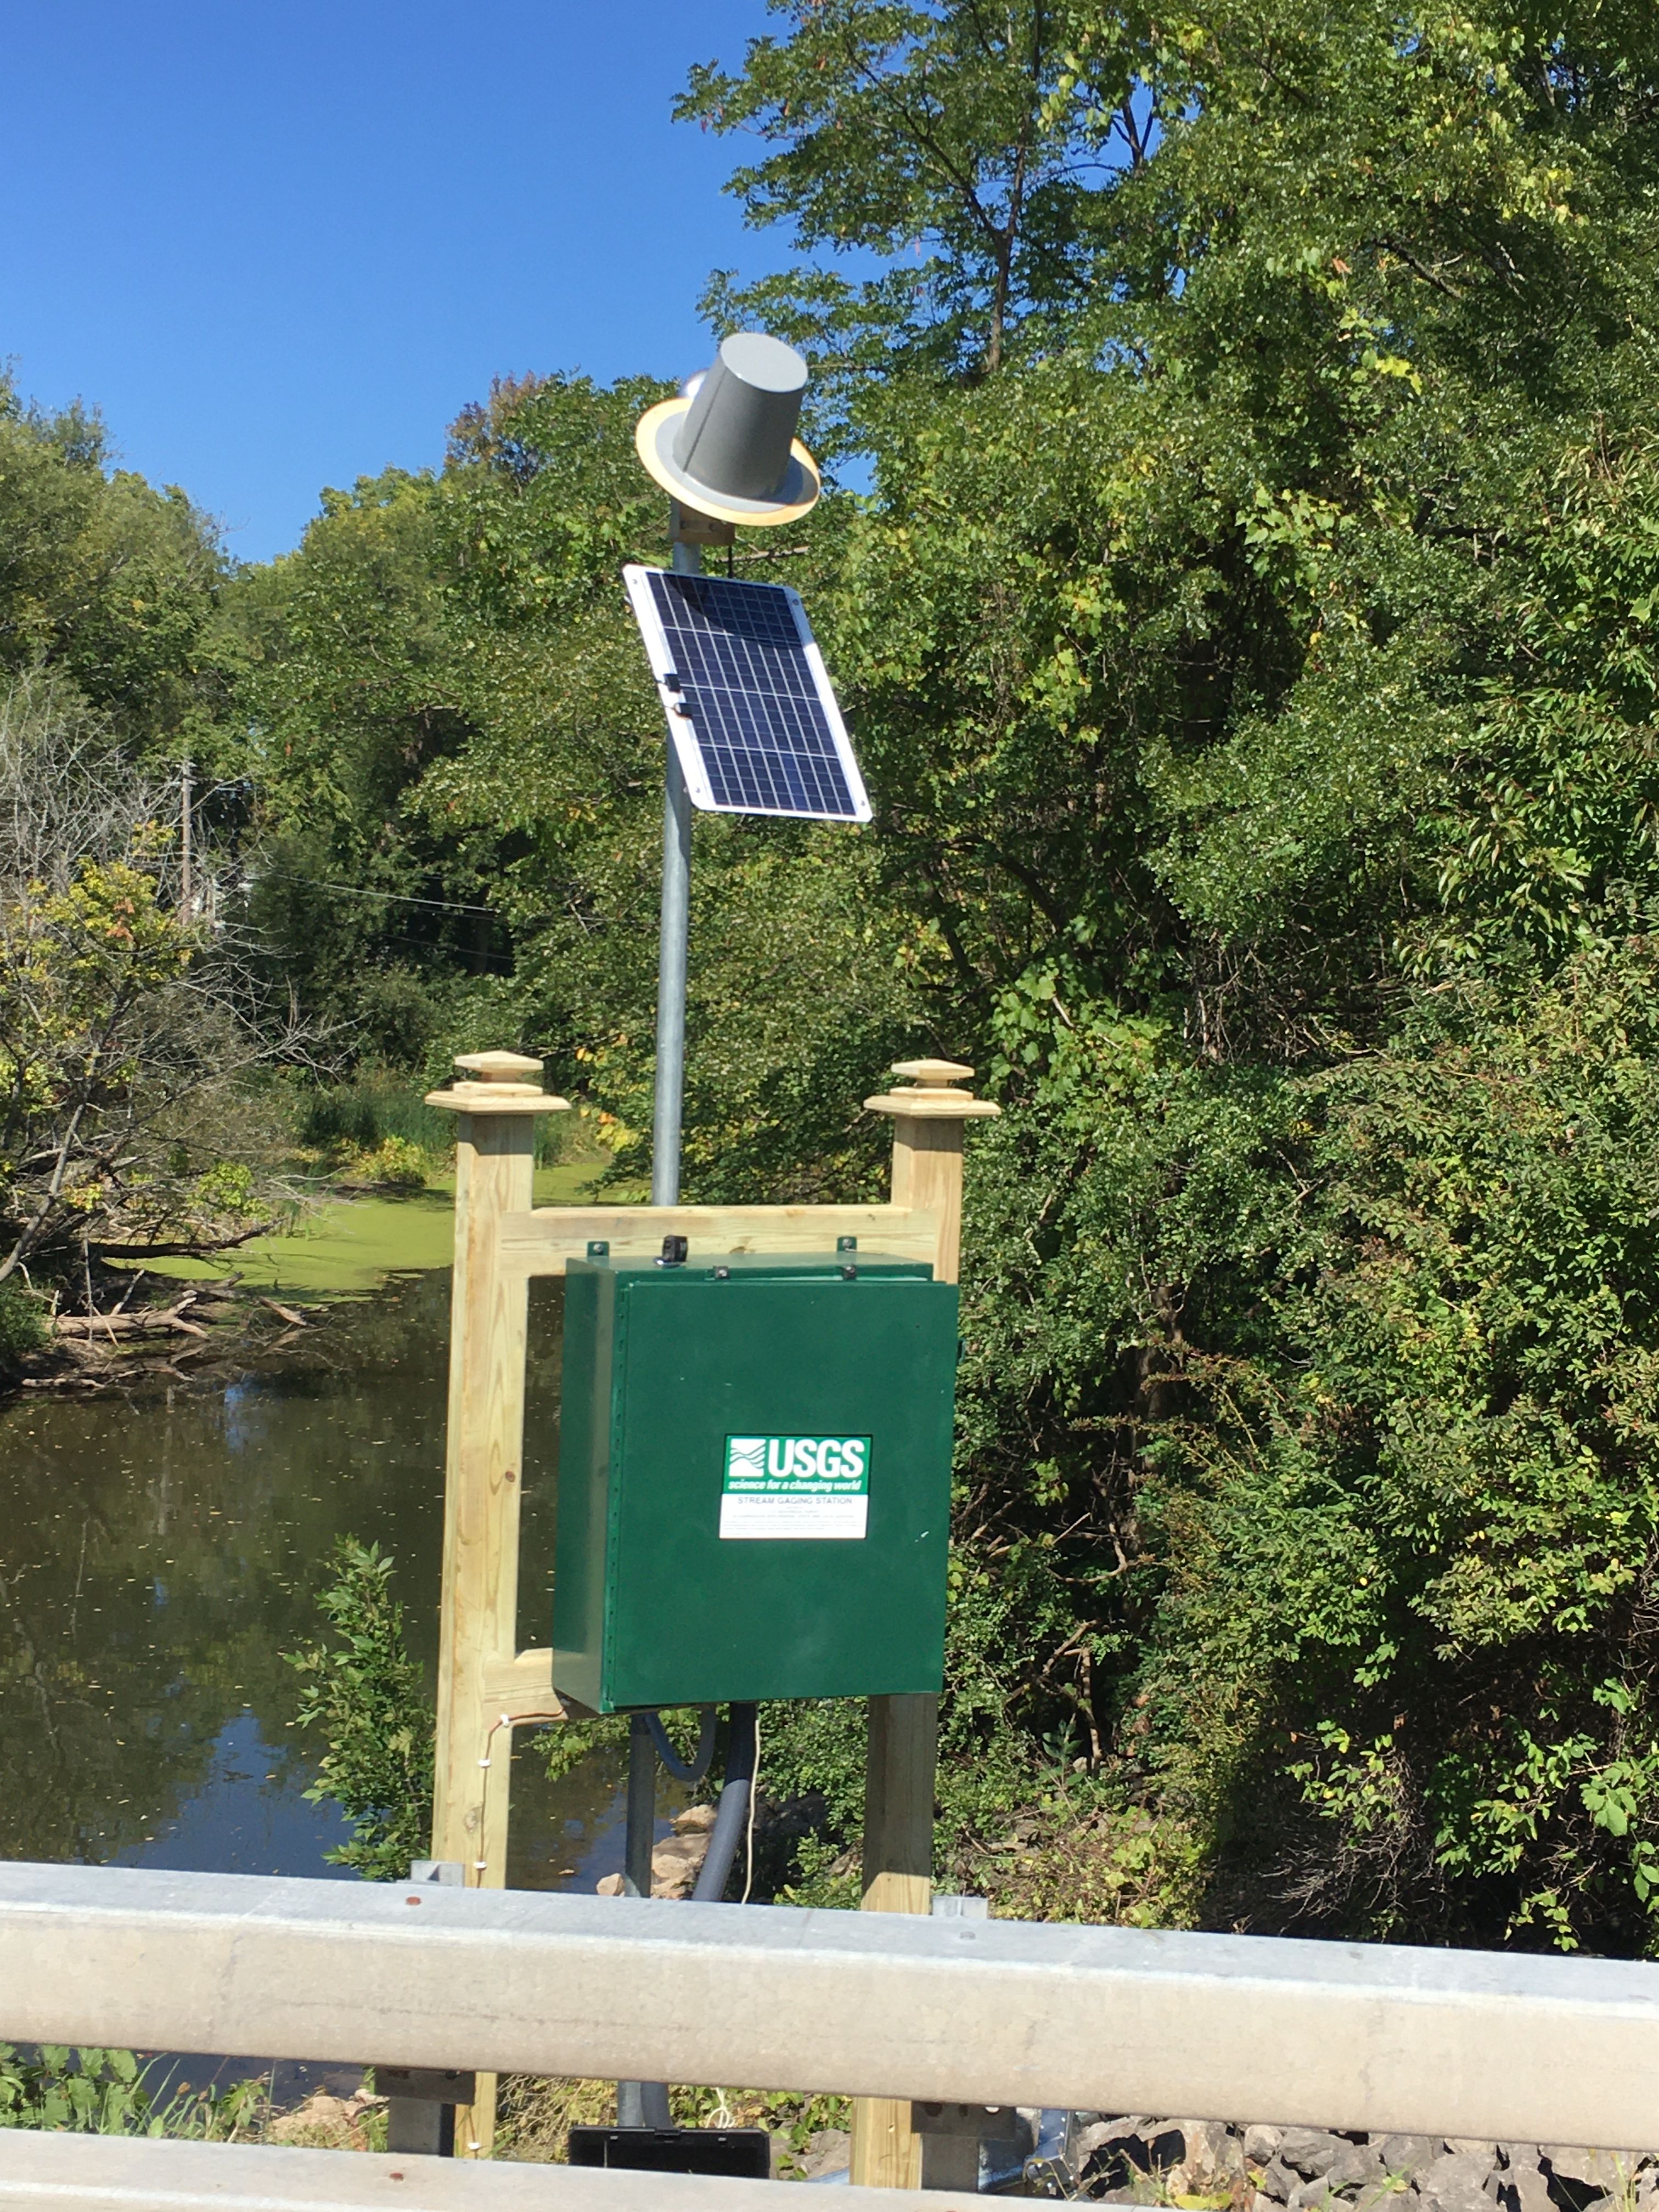 Station image
Summary of all available data for this site
Instantaneous-data availability statement


