PROVISIONAL DATA SUBJECT TO REVISION
Click to hidestation-specific text
Funding for this site is provided by:
 Site Information
LOCATION.--Lat 43°11'35.7", long
77°42'39.7" referenced to North American Datum of
1983, Monroe County, NY, Hydrologic Unit 04130001, on right
bank 35 ft upstream from the Round Pond Creek Dam discharge
control structure, 0.3 mi south of Straub Road, 1.1 mi
downstream of culvert underpass of the Erie (Barge) Canal, and
1.2 mi southwest of Greece.
DRAINAGE AREA.--7.83 mi².
PERIOD OF RECORD.--May 2021 to current year.
GAGE.--Water-stage recorder and crest-stage gage. Datum of gage is NGVD of 1929 (Town of Greece bench mark). To convert elevations to NAVD of 1988, subtract 0.63 ft.
REMARKS.--Round Pond Creek Dam is an earth-fill dam with a discharge control structure consisting of a 4 ft diameter concrete intake pipe and a 4 ft square sluice gate which is used to regulate the outflow from the impoundment of water during run-off events. In addition to the regulating structure, an emergency spillway is located at the northern end of the dam.
EXTREMES FOR PERIOD OF RECORD.--Maximum elevation, 454.99 ft, July 18, 2021; minimum elevation, 444.69 ft, Sept. 11, 2021.
EXTREMES OUTSIDE PERIOD OF RECORD.--On Mar. 24, 1978, water level in the retention basin upstream of Round Pond Creek Dam reached an elevation of 457.2 ft above NGVD of 1929 (456.6 ft above NAVD of 1988) as per a peak elevations document furnished by the Town Engineer, Town of Greece to Stetson Engineering as part of a Phase 1 Dam Safety Inspection dated June 1981.
 WaterAlert – get an
email or text (SMS) alert based on your chosen threshold.
WaterAlert – get an
email or text (SMS) alert based on your chosen threshold.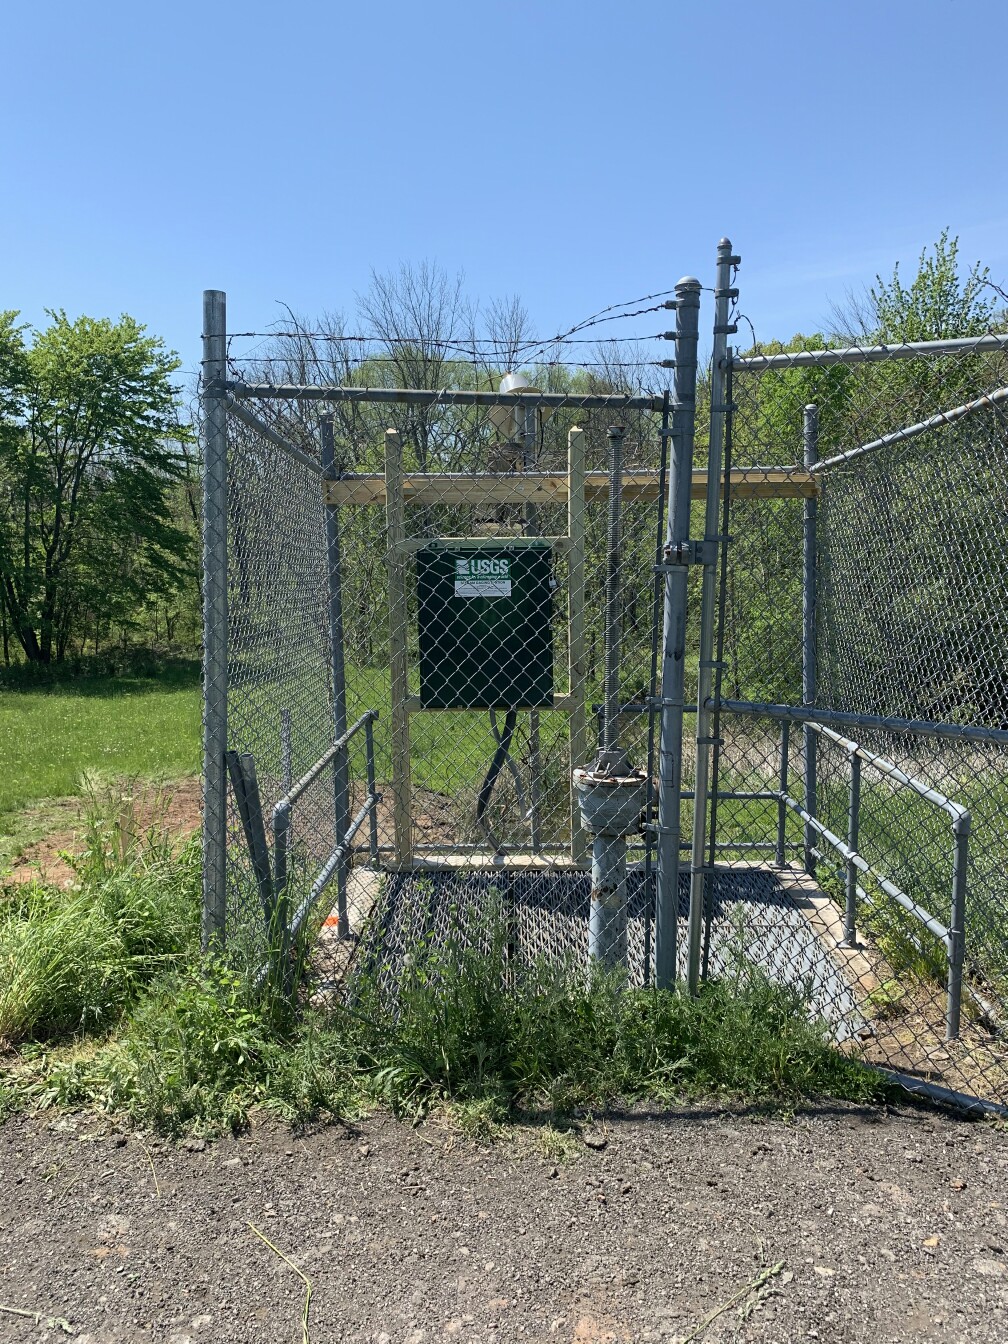 Station image
Summary of all available data for this site
Instantaneous-data availability statement
