PROVISIONAL DATA SUBJECT TO REVISION
Click to hidestation-specific text
Funding for this site is provided by:
 Site Information
LOCATION.--Lat 42°57'46.3", long
76°44'14.0" referenced to North American Datum of
1983, Seneca County, NY, Hydrologic Unit 04140201, on right
bank 50 ft upstream from bridge on State Highway 20 and 1.0 mi
downstream from Lock 1 on Cayuga-Seneca Canal.
DRAINAGE AREA.--1,566 mi².
PERIOD OF RECORD.--December 2014 to current year.
GAGE.--Acoustic velocity meter and water-stage recorder. Datum of gage is 367.00 ft above NAVD of 1988. Prior to Mar. 1, 2019, at datum 67.00 ft lower.
REMARKS.--Flow regulated by Lock 1 on Cayuga-Seneca Canal. Flow can be affected by operation of Erie (Barge) Canal.
Water Years 2015-16: Records good except those for estimated daily discharges, which are fair. Water Years 2017-23: Records good except those for estimated daily discharges and those below 500 ft³/s, which are poor.
EXTREMES FOR PERIOD OF RECORD.--Maximum daily discharge, 6,840 ft³/s, Nov. 9, 2021; minimum discharge not determined.
 WaterAlert – get an
email or text (SMS) alert based on your chosen threshold.
WaterAlert – get an
email or text (SMS) alert based on your chosen threshold.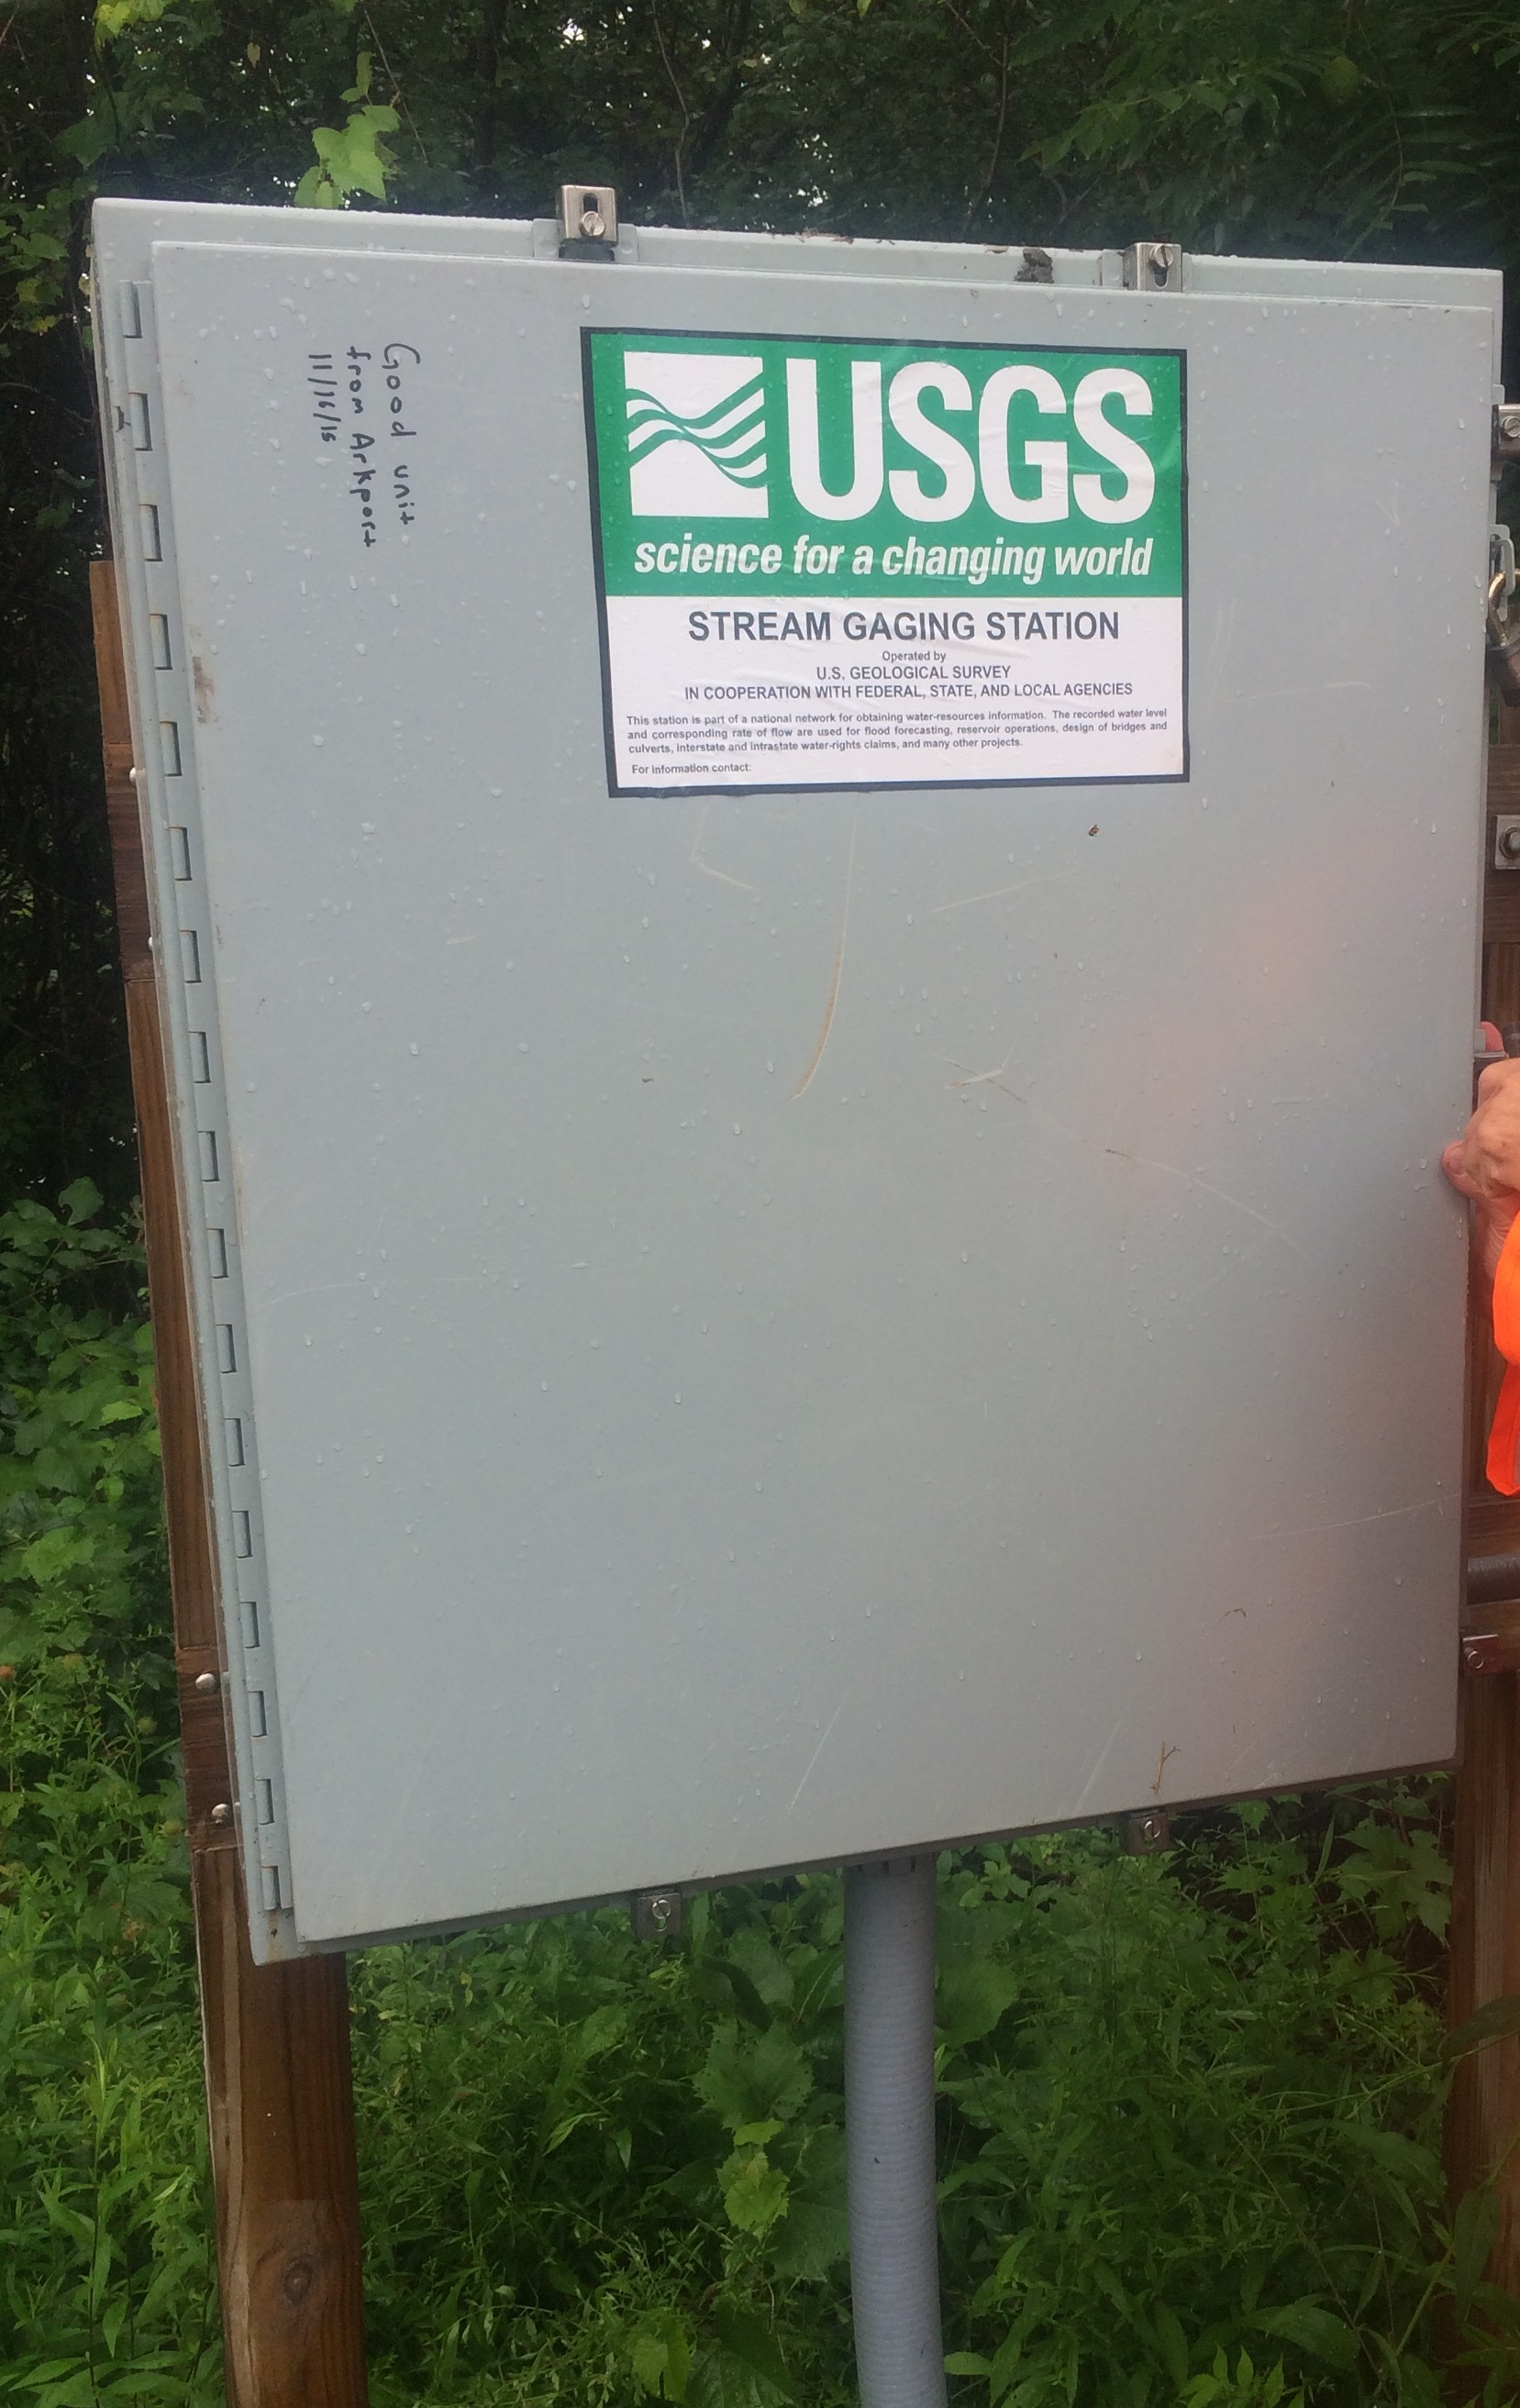 Station image
Summary of all available data for this site
Instantaneous-data availability statement


