PROVISIONAL DATA SUBJECT TO REVISION
Click to hidestation-specific text
Funding for this site is provided by:
 Site Information
LOCATION.--Lat 43°04'02.9", long
77°17'53.6" referenced to North American Datum of
1983, Wayne County, NY, Hydrologic Unit 04140201, on the right
bank 20 ft upstream from bridge on South Erie Street, 0.10 mi
south of Macedon, and 2.9 mi upstream from confluence with Erie
(Barge) Canal.
DRAINAGE AREA.--115 mi².
PERIOD OF RECORD.--October 2014 to current year.
GAGE.--Water-stage recorder and crest-stage gage. Datum of gage is 446.37 ft above NAVD of 1988.
REMARKS.--Water Years 2015-18: Records good except those for estimated daily discharges, which are fair. Water Years 2019-23: Records good except those for estimated daily discharges, which are poor.
EXTREMES FOR PERIOD OF RECORD.--Maximum discharge, 5,230 ft³/s, Oct. 27, 2021, gage height, 10.70 ft, from crest-stage gage; minimum discharge, 3.3 ft³/s, Aug. 31, Sept. 7, 16, 17, 2016; minimum gage height 1.47 ft, Aug. 9, 2016, Aug. 14, 15, 16, 2022.
 WaterAlert – get an
email or text (SMS) alert based on your chosen threshold.
WaterAlert – get an
email or text (SMS) alert based on your chosen threshold.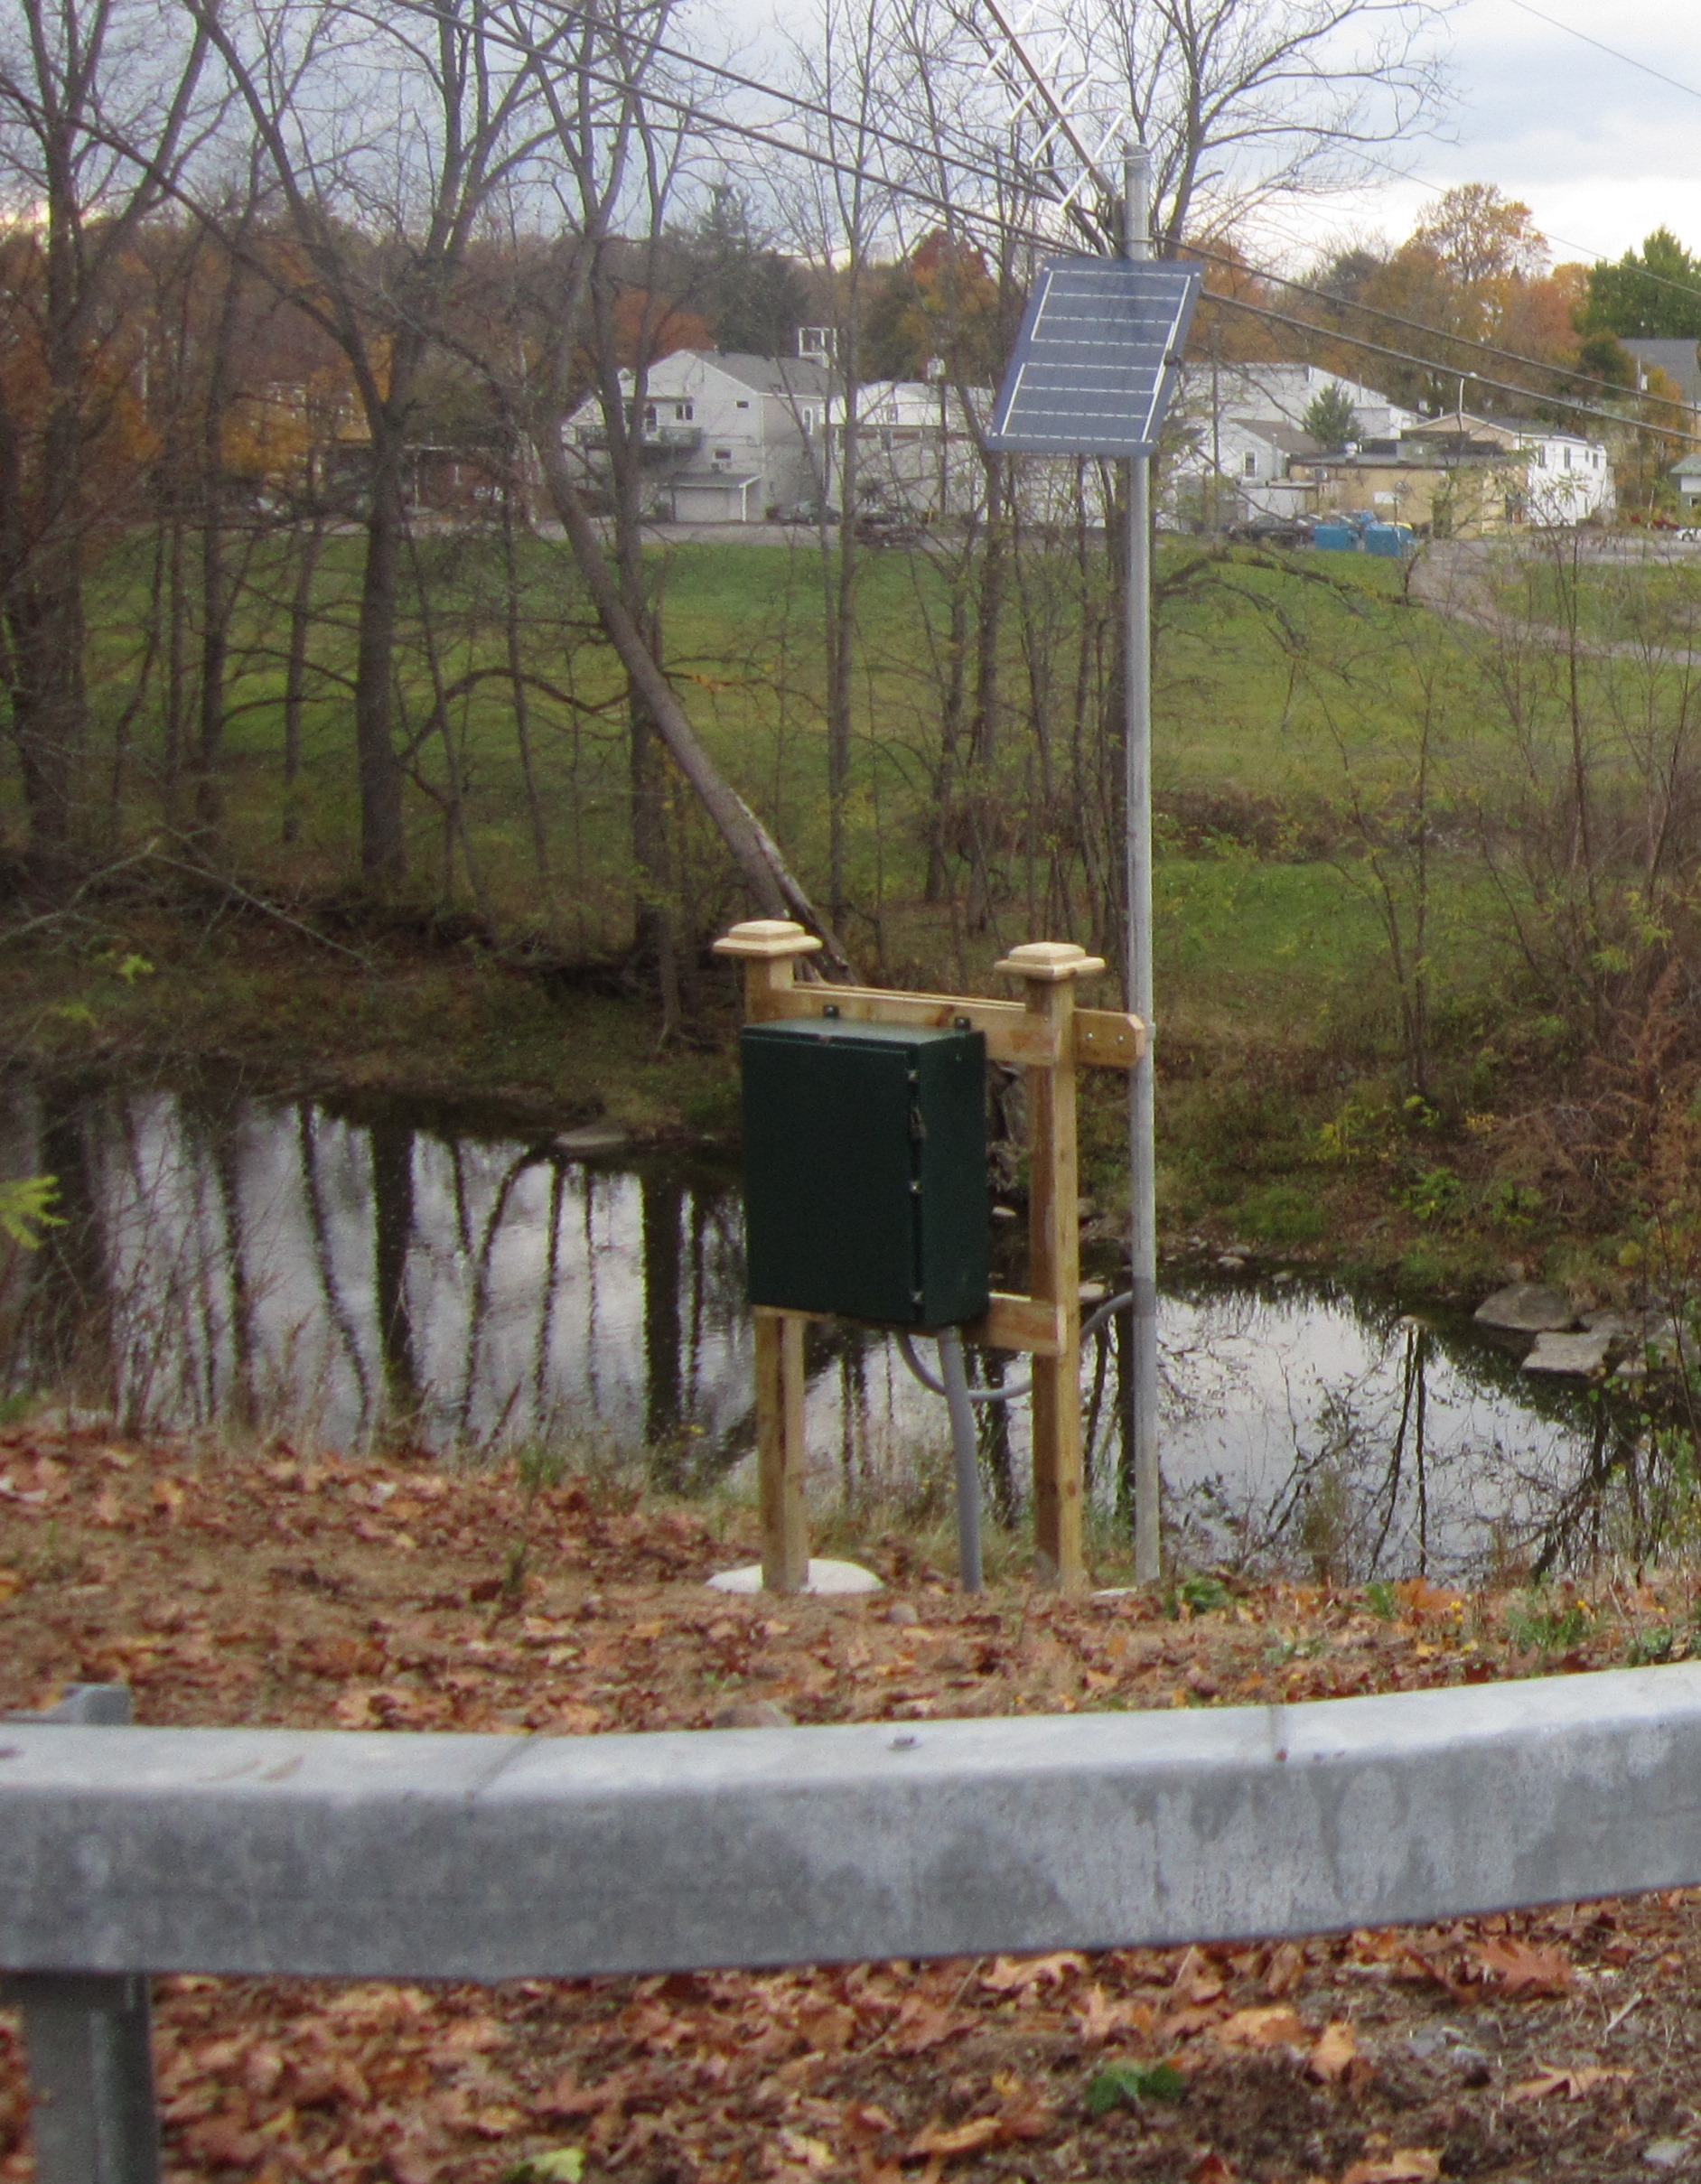 Station image
Summary of all available data for this site
Instantaneous-data availability statement

