PROVISIONAL DATA SUBJECT TO REVISION
Click to hidestation-specific text
Funding for this site is provided by:
 Site Information
LOCATION.--Lat 43°05'51.2", long
75°38'21.9" referenced to North American Datum of
1983, Oneida County, NY, Hydrologic Unit 04140202, on right
bank 70 ft upstream from bridge on Sconondoa Street at Oneida,
and 500 ft downstream from Sconondoa Creek.
DRAINAGE AREA.--113 mi².
PERIOD OF RECORD.--October 1949 to current year.
REVISIONS HISTORY.--WSP 2112: Drainage area. WDR NY-78-1: 1951 (P), 1956 (P), 1958 (P), 1961 (P), 1963 (P), 1964 (P), 1972 (P), 1976 (P). WDR NY-83-3: 1950 (M), 1972 (M), 1977 (M), 1979 (M).
GAGE.--Water-stage recorder. Datum of gage is 409.33 ft above NGVD of 1929 and 408.71 ft above NAVD of 1988.
REMARKS.--Occasional regulation by small mills upstream from station.
Water Years 2014-23: Records good except those for estimated daily discharges, which are poor.
EXTREMES FOR PERIOD OF RECORD.--Maximum discharge, 11,400 ft³/s, June 28, 2013, gage height, 17.23 ft, from rating curve extended above 7,500 ft³/s on basis of contracted-opening and flow-through-culvert measurements of peak flow at site 0.4 mi upstream (Oneida Creek), contracted-opening measurement of peak flow at site 1.0 mi upstream (Sconondoa Creek), and includes flow-over-levee measurements of peak flow upstream that bypassed gage, about 3,400 ft³/s; minimum discharge, 9.5 ft³/s, Sept. 6, 7, 1999; minimum gage height, 1.30 ft, Aug. 3, 6, 1955, Aug. 17, 1964.
 WaterAlert – get an
email or text (SMS) alert based on your chosen threshold.
WaterAlert – get an
email or text (SMS) alert based on your chosen threshold.
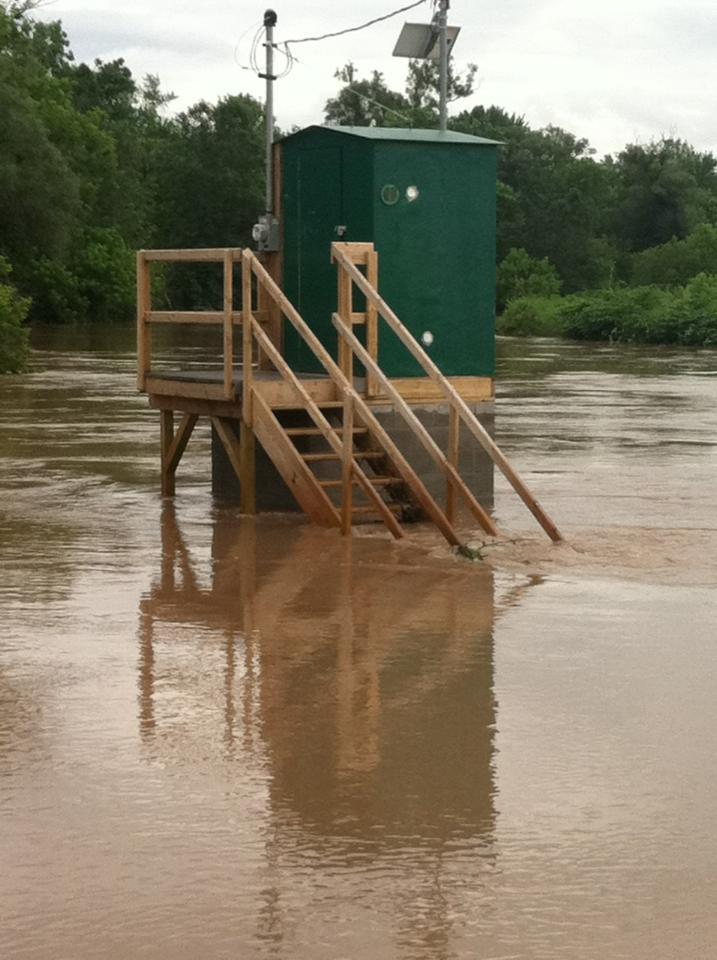 Station image
Summary of all available data for this site
Instantaneous-data availability statement

