PROVISIONAL DATA SUBJECT TO REVISION
Click to hidestation-specific text
Funding for this site is provided by:
 Site Information
LOCATION.--Lat 44°50'47.5", long
75°04'42.4" referenced to North American Datum of
1983, St. Lawrence County, NY, Hydrologic Unit 04150304, on
right bank 15 ft downstream from bridge on County Highway 36 at
Chase Mills, and 21 mi upstream from mouth.
DRAINAGE AREA.--598 mi².
PERIOD OF RECORD.--October 2003 to current year.
GAGE.--Water-stage recorder and crest-stage gage. Datum of gage is 226.00 ft above NGVD of 1929 (revised) and 225.59 ft above NAVD of 1988.
REMARKS.--Water Years 2014-23: Records good except those for estimated daily discharges, which are poor.
EXTREMES FOR PERIOD OF RECORD.--Maximum discharge, 11,400 ft³/s, Apr. 16, 2014, gage height, 7.73 ft; maximum gage height, 10.08 ft, Mar. 10, 2005 (ice jam); minimum discharge, 50 ft³/s, Sept. 8, 9, 2007, gage height, 3.90 ft.
 WaterAlert – get an
email or text (SMS) alert based on your chosen threshold.
WaterAlert – get an
email or text (SMS) alert based on your chosen threshold.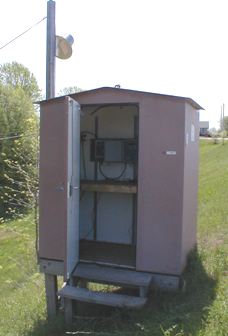 Station image
Summary of all available data for this site
Instantaneous-data availability statement

