PROVISIONAL DATA SUBJECT TO REVISION
Click to hidestation-specific text
Funding for this site is provided by:
 Site Information
LOCATION.--Lat 43°19'08.6", long
73°50'39.5" referenced to North American Datum of
1983, Saratoga County, NY, Hydrologic Unit 02020001, on right
bank at Hadley, 400 ft downstream from outlet of Lake Luzerne,
and 0.3 mi upstream from Sacandaga River.
DRAINAGE AREA.--1,664 mi².
PERIOD OF RECORD.--July 1921 to current year.
REVISIONS HISTORY.--WSP 561: 1921-22. WSP 756: Drainage area. WSP 1432: 1931 (m).
GAGE.--Water-stage recorder and crest-stage gage. Datum of gage is 563.99 ft above NGVD of 1929 and 563.68 ft above NAVD of 1988.
REMARKS.--Some diurnal fluctuation caused by powerplant on Schroon River. Flow regulated by Indian Lake (station 01314500), Lake Abanakee and other reservoirs upstream from station.
Water Years 2014-23: Records good except those for estimated daily discharges, which are poor.
EXTREMES FOR PERIOD OF RECORD.--Maximum discharge, 44,200 ft³/s, Apr. 29, 2011, gage height, 21.32 ft; minimum discharge, 196 ft³/s, Sept. 3, 1999, gage height, 0.63 ft.
EXTREMES OUTSIDE PERIOD OF RECORD.--Discharge for the flood of Mar. 27, 1913, about 49,000 ft³/s, based on peak runoff comparison with a station 12.7 mi upstream (drainage area 1,533 mi²).
 WaterAlert – get an
email or text (SMS) alert based on your chosen threshold.
WaterAlert – get an
email or text (SMS) alert based on your chosen threshold.
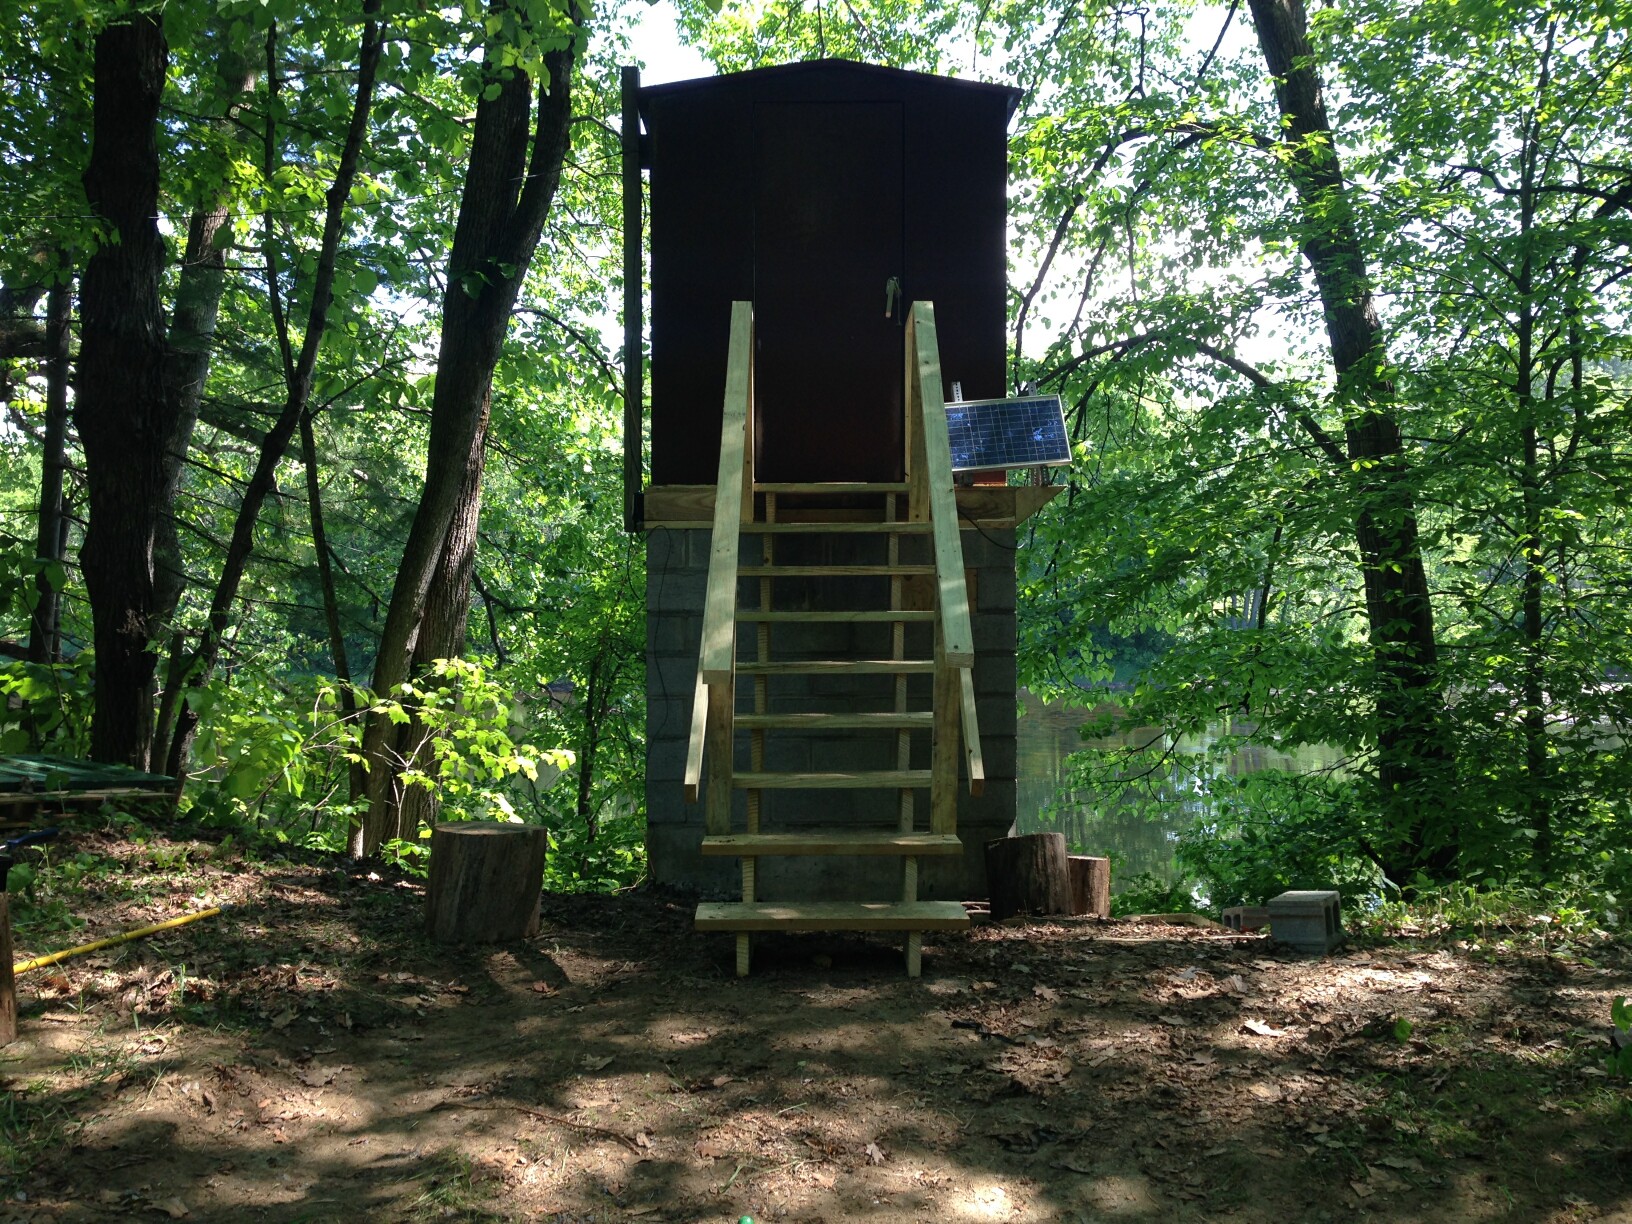 Station image
Summary of all available data for this site
Instantaneous-data availability statement

