PROVISIONAL DATA SUBJECT TO REVISION
Click to hidestation-specific text
Funding for this site is provided by:
 Site Information
LOCATION.--Lat 42°06'45.5", long
79°12'13.1" referenced to North American Datum of
1983, Chautauqua County, NY, Hydrologic Unit 05010002, on left
bank 10 ft downstream from South Dow Street Bridge in Falconer,
1.8 mi upstream from mouth, and 6 mi downstream from Chautauqua
Lake.
DRAINAGE AREA.--194 mi².
PERIOD OF RECORD.--November 1934 to current year.
REVISIONS HISTORY.--WSP 803: 1936 (M). WDR NY-98-3: 1997 (M).
GAGE.--Water-stage recorder, crest-stage gage, and concrete control. Datum of gage is 1,256.41 ft above NGVD of 1929 and 1,255.88 ft above NAVD of 1988.
REMARKS.--Flow regulated by Chautauqua Lake. Diurnal fluctuation caused by mills upstream from station. Monthly figures for 1951-66 water years adjusted for regulation.
Water Years 2014-23: Records good except for those for estimated daily discharges, which are fair.
EXTREMES FOR PERIOD OF RECORD.--Maximum discharge, 2,400 ft³/s, July 17, 2021, gage height, 4.82 ft; maximum gage height, 4.93 ft, Sept. 14, 1979; no flow for part of July 30, 2011, result of regulation.
 WaterAlert – get an
email or text (SMS) alert based on your chosen threshold.
WaterAlert – get an
email or text (SMS) alert based on your chosen threshold.
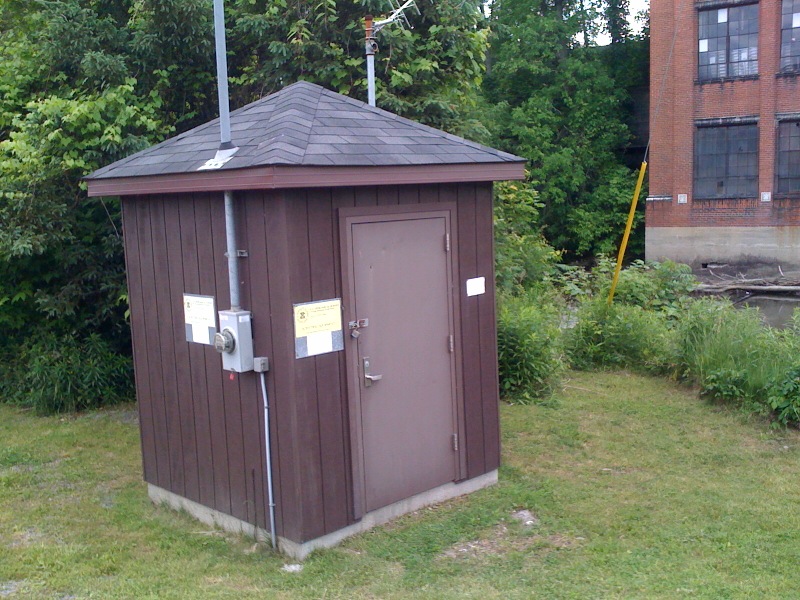 Station image
Summary of all available data for this site
Instantaneous-data availability statement

