PROVISIONAL DATA SUBJECT TO REVISION
Click to hidestation-specific text
Funding for this site is provided by:
 Site Information
LOCATION.--Lat 43°36'37.1", long
75°06'35.8" referenced to North American Datum of
1983, Herkimer County, NY, Hydrologic Unit 04150101, on left
bank 0.5 mi west of McKeever, and 1.9 mi downstream from
confluence of South and Middle Branches.
DRAINAGE AREA.--363 mi².
PERIOD OF RECORD.--Continuous record--June 1900 to September 1970, occasional discharge measurements, water years 1971, 1977, annual maximum only--1987 to current year. October 2017 to current year (gage heights only). Monthly discharge only for some periods, published in WSP 1307. Prior to Oct. 1, 1922, published as "at Moose River".
REVISIONS HISTORY.--WSP 624: 1922(M). WSP 729: Drainage area. WSP 874: 1928.
GAGE.--Water-stage recorder and crest-stage gage. Datum of gage is 1,479.92 ft above NGVD of 1929 and 1,479.71 ft above NAVD of 1988. Prior to Oct. 1, 1922, at site 2.5 mi downstream at various datums. Oct. 1 to Nov. 2, 1922, at present site at datum 1 ft higher.
REMARKS.--Flow regulated to some extent by Fulton Chain of Lakes since about 1880.
EXTREMES FOR PERIOD OF RECORD.--Maximum discharge, 18,700 ft³/s, June, 3, 1947, result of dam failure, from rating curve extended above 12,000 ft³/s on basis of slope-conveyance study, gage height, 17.45 ft, from floodmark.
EXTREMES OUTSIDE PERIOD OF RECORD.--Flood of Dec. 29, 1984, reached a stage of 16.0 ft, from floodmarks, discharge, 15,800 ft³/s.
 WaterAlert – get an
email or text (SMS) alert based on your chosen threshold.
WaterAlert – get an
email or text (SMS) alert based on your chosen threshold.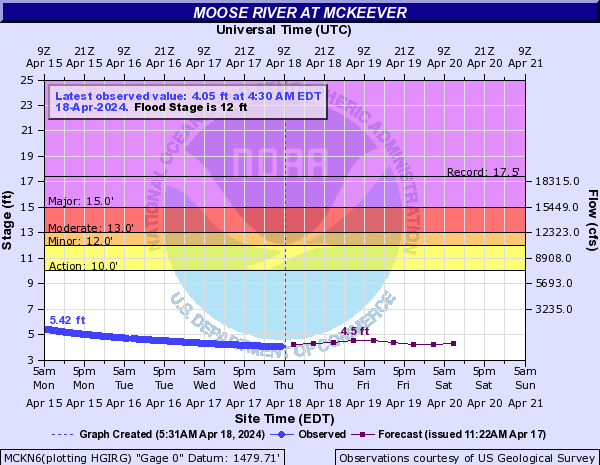
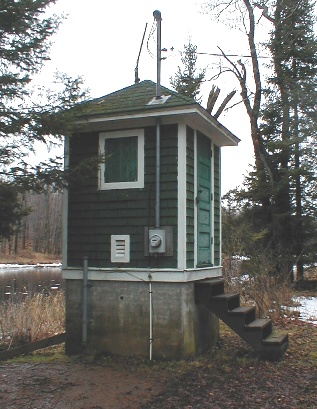 Station image
Summary of all available data for this site
Instantaneous-data availability statement
