PROVISIONAL DATA SUBJECT TO REVISION
Click to hidestation-specific text
Funding for this site is provided by:
 Site Information
LOCATION.--Lat 42°19'51.8", long
73°44'40.0" referenced to North American Datum of
1983, Columbia County, NY, Hydrologic Unit 02020006, on right
bank just downstream from Rossman Road bridge, 1.0 mi upstream
from Claverack Creek, and 2.25 mi downstream from Stuyvesant
Falls, in Rossman.
DRAINAGE AREA.--329 mi².
PERIOD OF RECORD.--March 1906 to June 1911, July 1911 to May 1914 (fragmentary, monthly discharge only for some periods, published in WSP 1302), July 1928 to September 1968, annual maximum only--1984, 1988-2011, August 2011 to current year.
GAGE.--Water-stage recorder and crest-stage gage. Datum of gage is 24.78 ft above NGVD of 1929 and 24.33 ft above NAVD of 1988. Prior to May 1914, at same site at different datum, and 1928-1962 water years, at same site at datum 1.00 ft higher.
REMARKS.--Diurnal fluctuation and considerable regulation at low and medium flow caused by power plants above station.
Water Years 2014-23: Records fair except those for estimated daily discharges, which are poor.
EXTREMES FOR PERIOD OF RECORD.--Maximum discharge, 29,800 ft³/s, Dec. 31, 1948, gage height, 20.8 ft, present datum, from floodmarks; minimum discharge not determined.
PERIOD OF DAILY RECORD1.--SUSPENDED-SEDIMENT DISCHARGE: August 2011 to February 2014 (discontinued).
EXTREMES FOR PERIOD OF DAILY RECORD1.--SUSPENDED-SEDIMENT CONCENTRATION: Maximum daily mean, 1,070 mg/L, Aug. 28, 2011; minimum daily mean, 1 mg/L, Nov. 26, Dec. 1, 2, 2012.
SUSPENDED-SEDIMENT DISCHARGE: Maximum daily, 27,900 tons, Aug. 29, 2011; minimum daily, 0.44 tons, July 4, Aug. 9, 2012.
1 Water-Quality Records
 WaterAlert – get an
email or text (SMS) alert based on your chosen threshold.
WaterAlert – get an
email or text (SMS) alert based on your chosen threshold.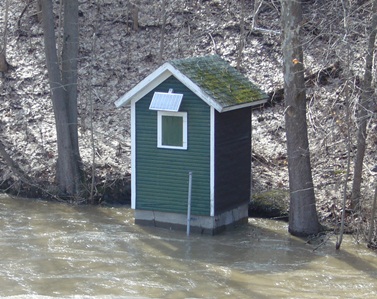 Station image
Instantaneous-data availability statement

