PROVISIONAL DATA SUBJECT TO REVISION
Click to hidestation-specific text
Funding for this site is provided by:
 Site Information
LOCATION.--Lat 41°13'30.1", long
73°51'32.0" referenced to North American Datum of
1983, Westchester County, NY, Hydrologic Unit 02030101, on left
bank 1,000 ft downstream from New Croton Dam, and 1.8 mi
northeast of Croton-On-Hudson.
DRAINAGE AREA.--378 mi².
PERIOD OF RECORD.--July 1933 to current year. Prior to Oct. 1, 1941, published as "at Quaker Bridge," (low-flow records at this site are not equivalent owing to well pumpage upstream). Fragmentary records published during August 1933 to September 1941 for "at Cornell Dam near Croton" and "at New Croton near Croton" are equivalent. Oct. 1, 1941 to Sept. 30, 1955 published as "at New Croton Dam near Croton".
REVISIONS HISTORY.--WDR NY-69-1: 1968 (M).
GAGE.--Water-stage recorder, crest-stage gage, and concrete control. Datum of gage is 43.12 ft above NAVD of 1988. Prior to Oct. 1, 1941, supplementary water-stage recorder and concrete control at site 1.1 mi downstream at Quaker Bridge.
REMARKS.--Entire flow, except for periods of spilling and releases to augment Croton-on-Hudson water supply, diverted from New Croton Reservoir for municipal supply of City of New York.
Water Years 2014-20: Records good except those for estimated daily discharges, which are poor. Water Years 2021-24: Records fair except those for estimated daily discharges, which are poor.
EXTREMES FOR PERIOD OF RECORD.--Maximum discharge, 45,400 ft³/s, Oct. 16, 1955, gage height, 18.44 ft, from floodmarks, from rating curve extended above 9,900 ft³/s on basis of slope-area measurement of peak flow; minimum discharge not determined; minimum gage height, 0.11 ft, July 15, 1965.
 WaterAlert – get an
email or text (SMS) alert based on your chosen threshold.
WaterAlert – get an
email or text (SMS) alert based on your chosen threshold.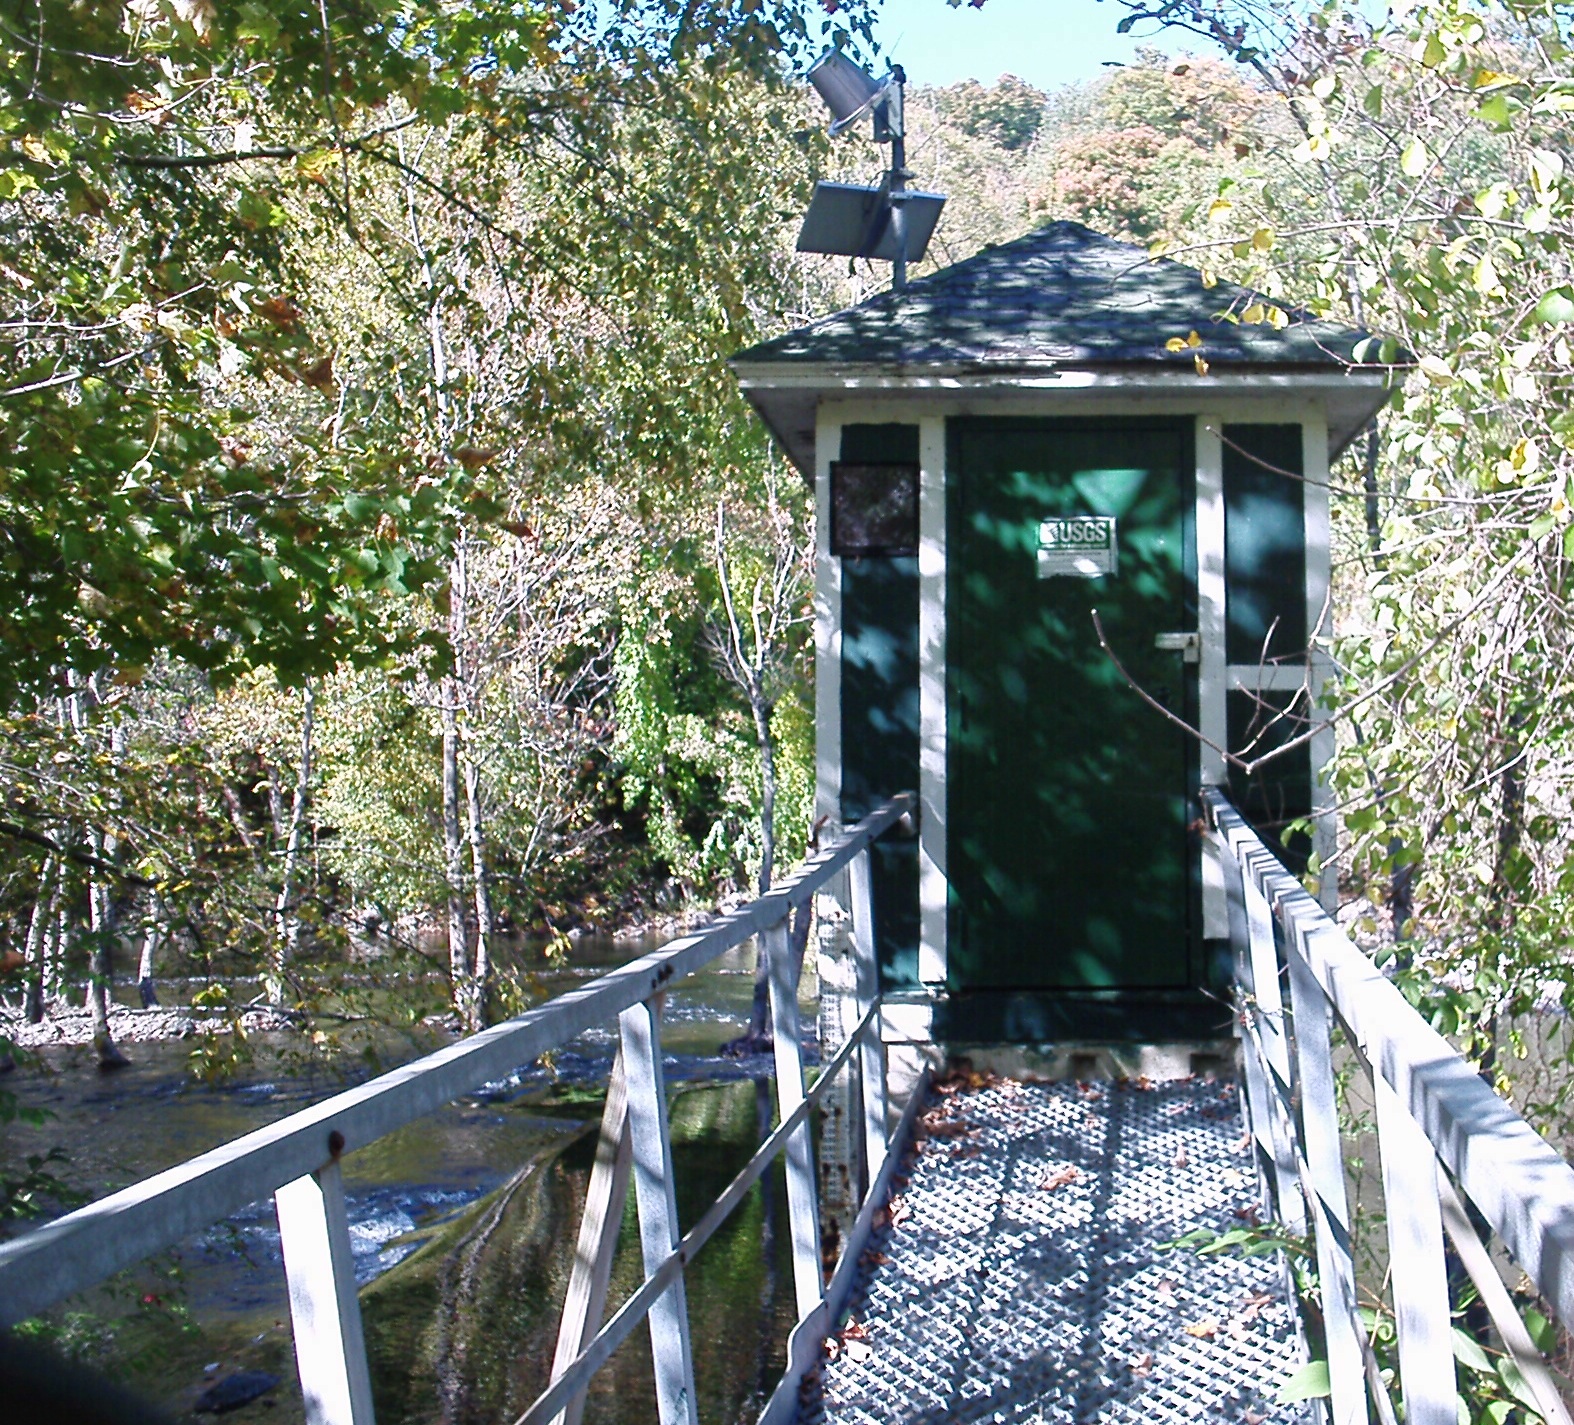 Station image
Summary of all available data for this site
Instantaneous-data availability statement

