PROVISIONAL DATA SUBJECT TO REVISION
Click to hidestation-specific text
Funding for this site is provided by:
 Site Information
LOCATION.--Lat 42°16'49", long
74°54'26" referenced to North American Datum of 1983,
Delaware County, NY, Hydrologic Unit 02040101, on left bank
along County Highway 18, 0.6 mi upstream from State Highway 28
bridge in Delhi, and 1.9 mi upstream from Little Delaware
River.
DRAINAGE AREA.--134 mi².
PERIOD OF RECORD.--February 1937 to September 1970, annual maximum only--1972-74, 1996, maximum only--November 1996, December 1996 to current year. Prior to November 1996, published as West Branch Delaware River at Delhi (station 01422000).
GAGE.--Water-stage recorder and crest-stage gage. Datum of gage is 1,351.31 ft above NGVD of 1929 and 1,350.34 ft above NAVD of 1988. Prior to October 1996, at site 0.9 mi downstream at datum 1,345.29 ft above NGVD of 1929.
REMARKS.--Water Years 2014-22: Records good except those for estimated daily discharges, which are poor.
EXTREMES FOR PERIOD OF RECORD.--Maximum discharge, about 13,000 ft³/s, Jan. 19, 1996, gage height, 9.8 ft, from floodmark, from rating curve extended above 4,800 ft³/s on basis of velocity-area studies, at site and datum then in use; maximum gage height, 12.53 ft, Aug. 28, 2011; minimum discharge, 2.6 ft³/s, Sept. 25, 1964; minimum gage height recorded since December 1996, 1.70 ft, Sept. 22, 23, 2019, but may have been less during period of estimated record Sept. 21-24, 2001.
 WaterAlert – get an
email or text (SMS) alert based on your chosen threshold.
WaterAlert – get an
email or text (SMS) alert based on your chosen threshold.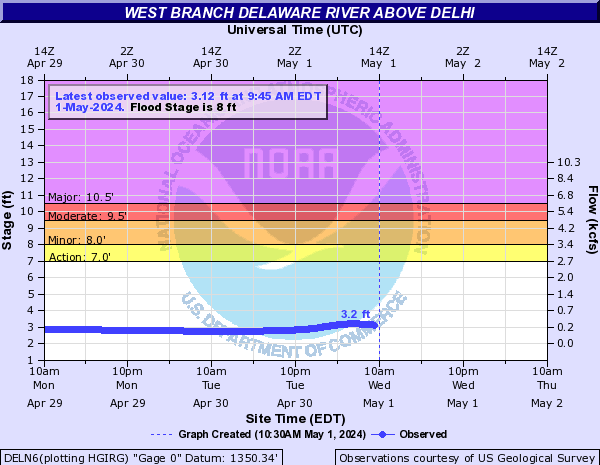 Additional Site
Information
Additional Site
Information
Peak Flow and Stage Information
This streamgage supports a flood inundation map (FIM) library for this area.
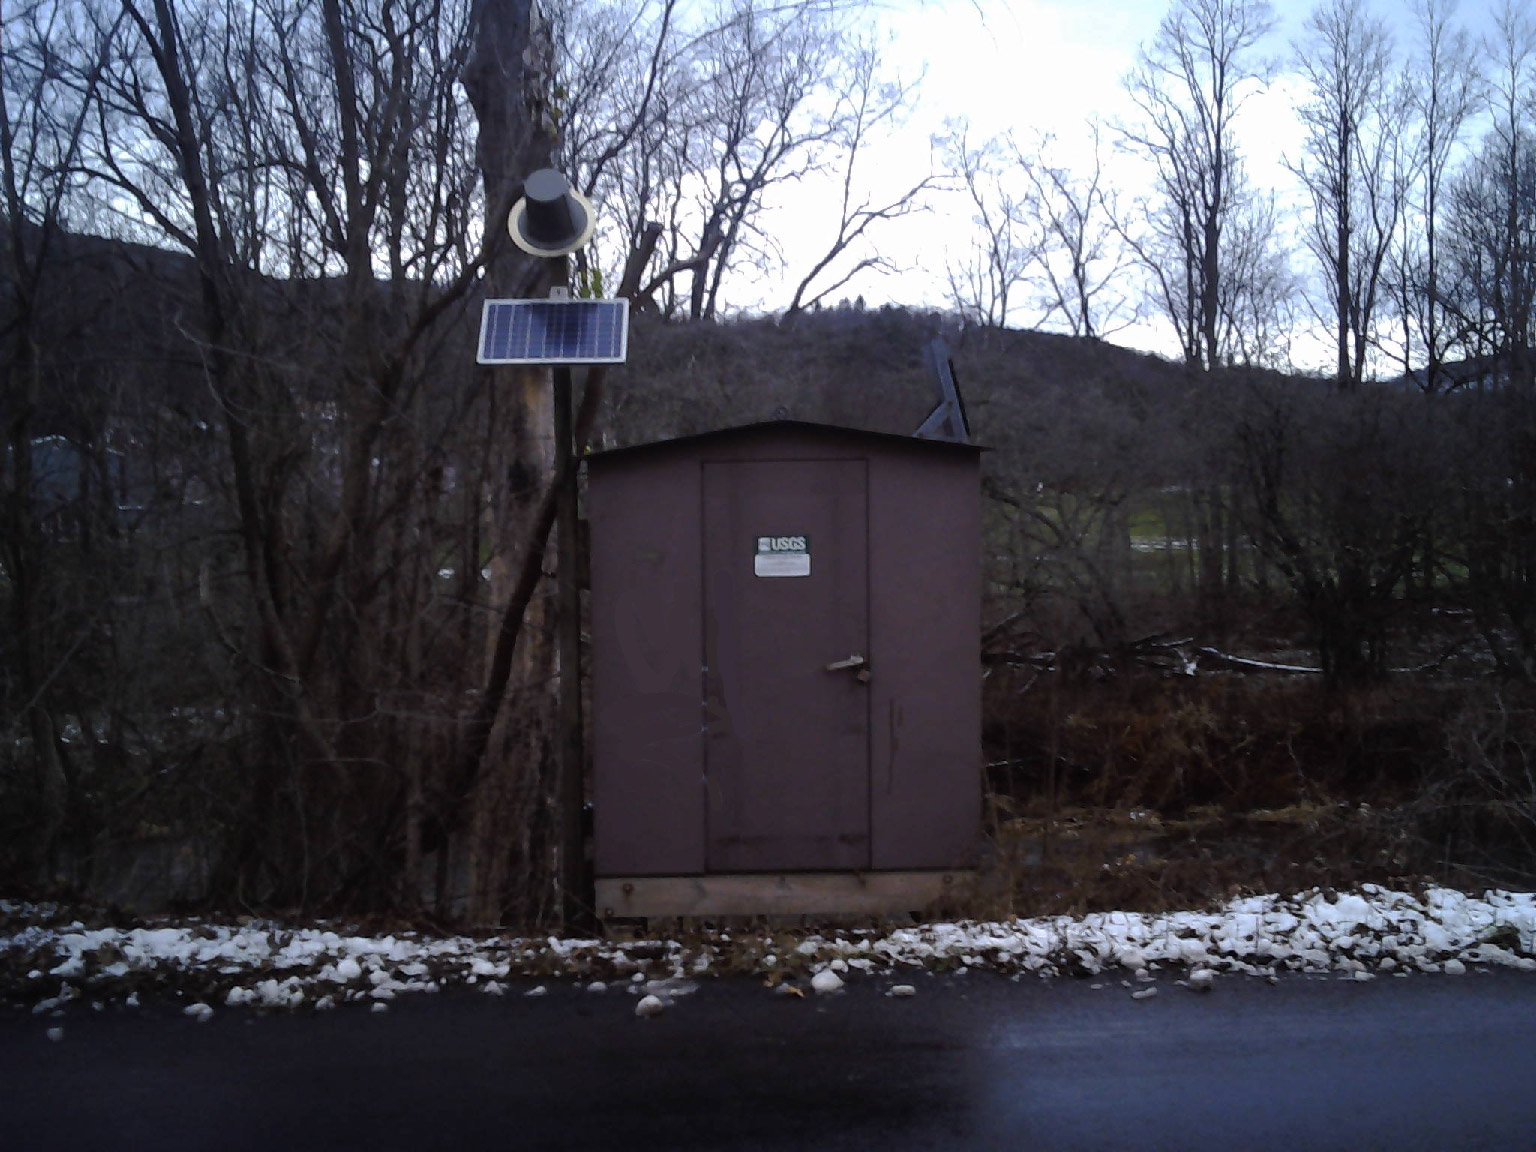 Station image
Summary of all available data for this site
Instantaneous-data availability statement

