PROVISIONAL DATA SUBJECT TO REVISION
Click to hidestation-specific text
Funding for this site is provided by:
 Site Information
LOCATION.--Lat 42°18'48.5", long
77°39'03.9" referenced to North American Datum of
1983, Steuben County, NY, Hydrologic Unit 02050104, on right
bank 235 ft upstream from Erie Railroad bridge in Hornell, 0.3
mi upstream from Crosby Creek, and 1.5 mi downstream from
Canacadea Creek.
DRAINAGE AREA.--158 mi².
PERIOD OF RECORD.--August 1942 to current year.
REVISIONS HISTORY.--WDR NY-86-3: 1971 (including minimum daily).
GAGE.--Water-stage recorder, crest-stage gage, and concrete control. Datum of gage is 1,131.32 ft above NGVD of 1929 and 1,130.88 ft above NAVD of 1988.
REMARKS.--Diversion from Carrington Creek, a tributary upstream from station, by City of Hornell for municipal supply; effluent from wastewater treatment plant enters river downstream from gage. Since March 1940, flood flows regulated by Arkport Reservoir (station 01521000), and since June 1949, by Almond Lake (station 01523000); normal regulation occasionally sufficient to affect figures of monthly runoff.
Water Years 2014-17: Records good except those for estimated daily discharges, which are fair. Water Years 2018-23: Records good except those for estimated daily discharges, which are poor.
EXTREMES FOR PERIOD OF RECORD.--Maximum discharge, since construction of Almond Lake in 1949, 9,560 ft³/s, June 23, 1972, gage height, 13.45 ft, from floodmark, from rating curve extended above 7,600 ft³/s on basis of critical-depth measurement at gage height 13.30 ft; minimum discharge, 7.4 ft³/s, Sept. 13, 14, 1955.
EXTREMES FOR PERIOD PRIOR TO REGULATION.--Maximum discharge, prior to construction of Almond Lake in 1949, 9,340 ft³/s, May 26, 1943, gage height 13.30 ft, from rating curve extended above 7,600 ft³/s on basis of critical-depth measurement of peak flow; minimum discharge, 9.3 ft³/s, Mar. 4, 1947.
 WaterAlert – get an
email or text (SMS) alert based on your chosen threshold.
WaterAlert – get an
email or text (SMS) alert based on your chosen threshold.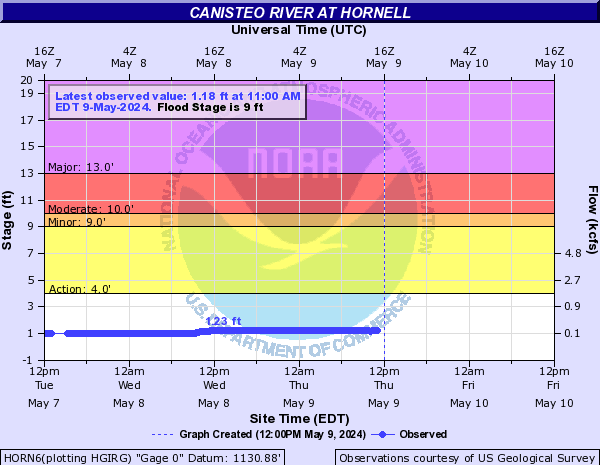
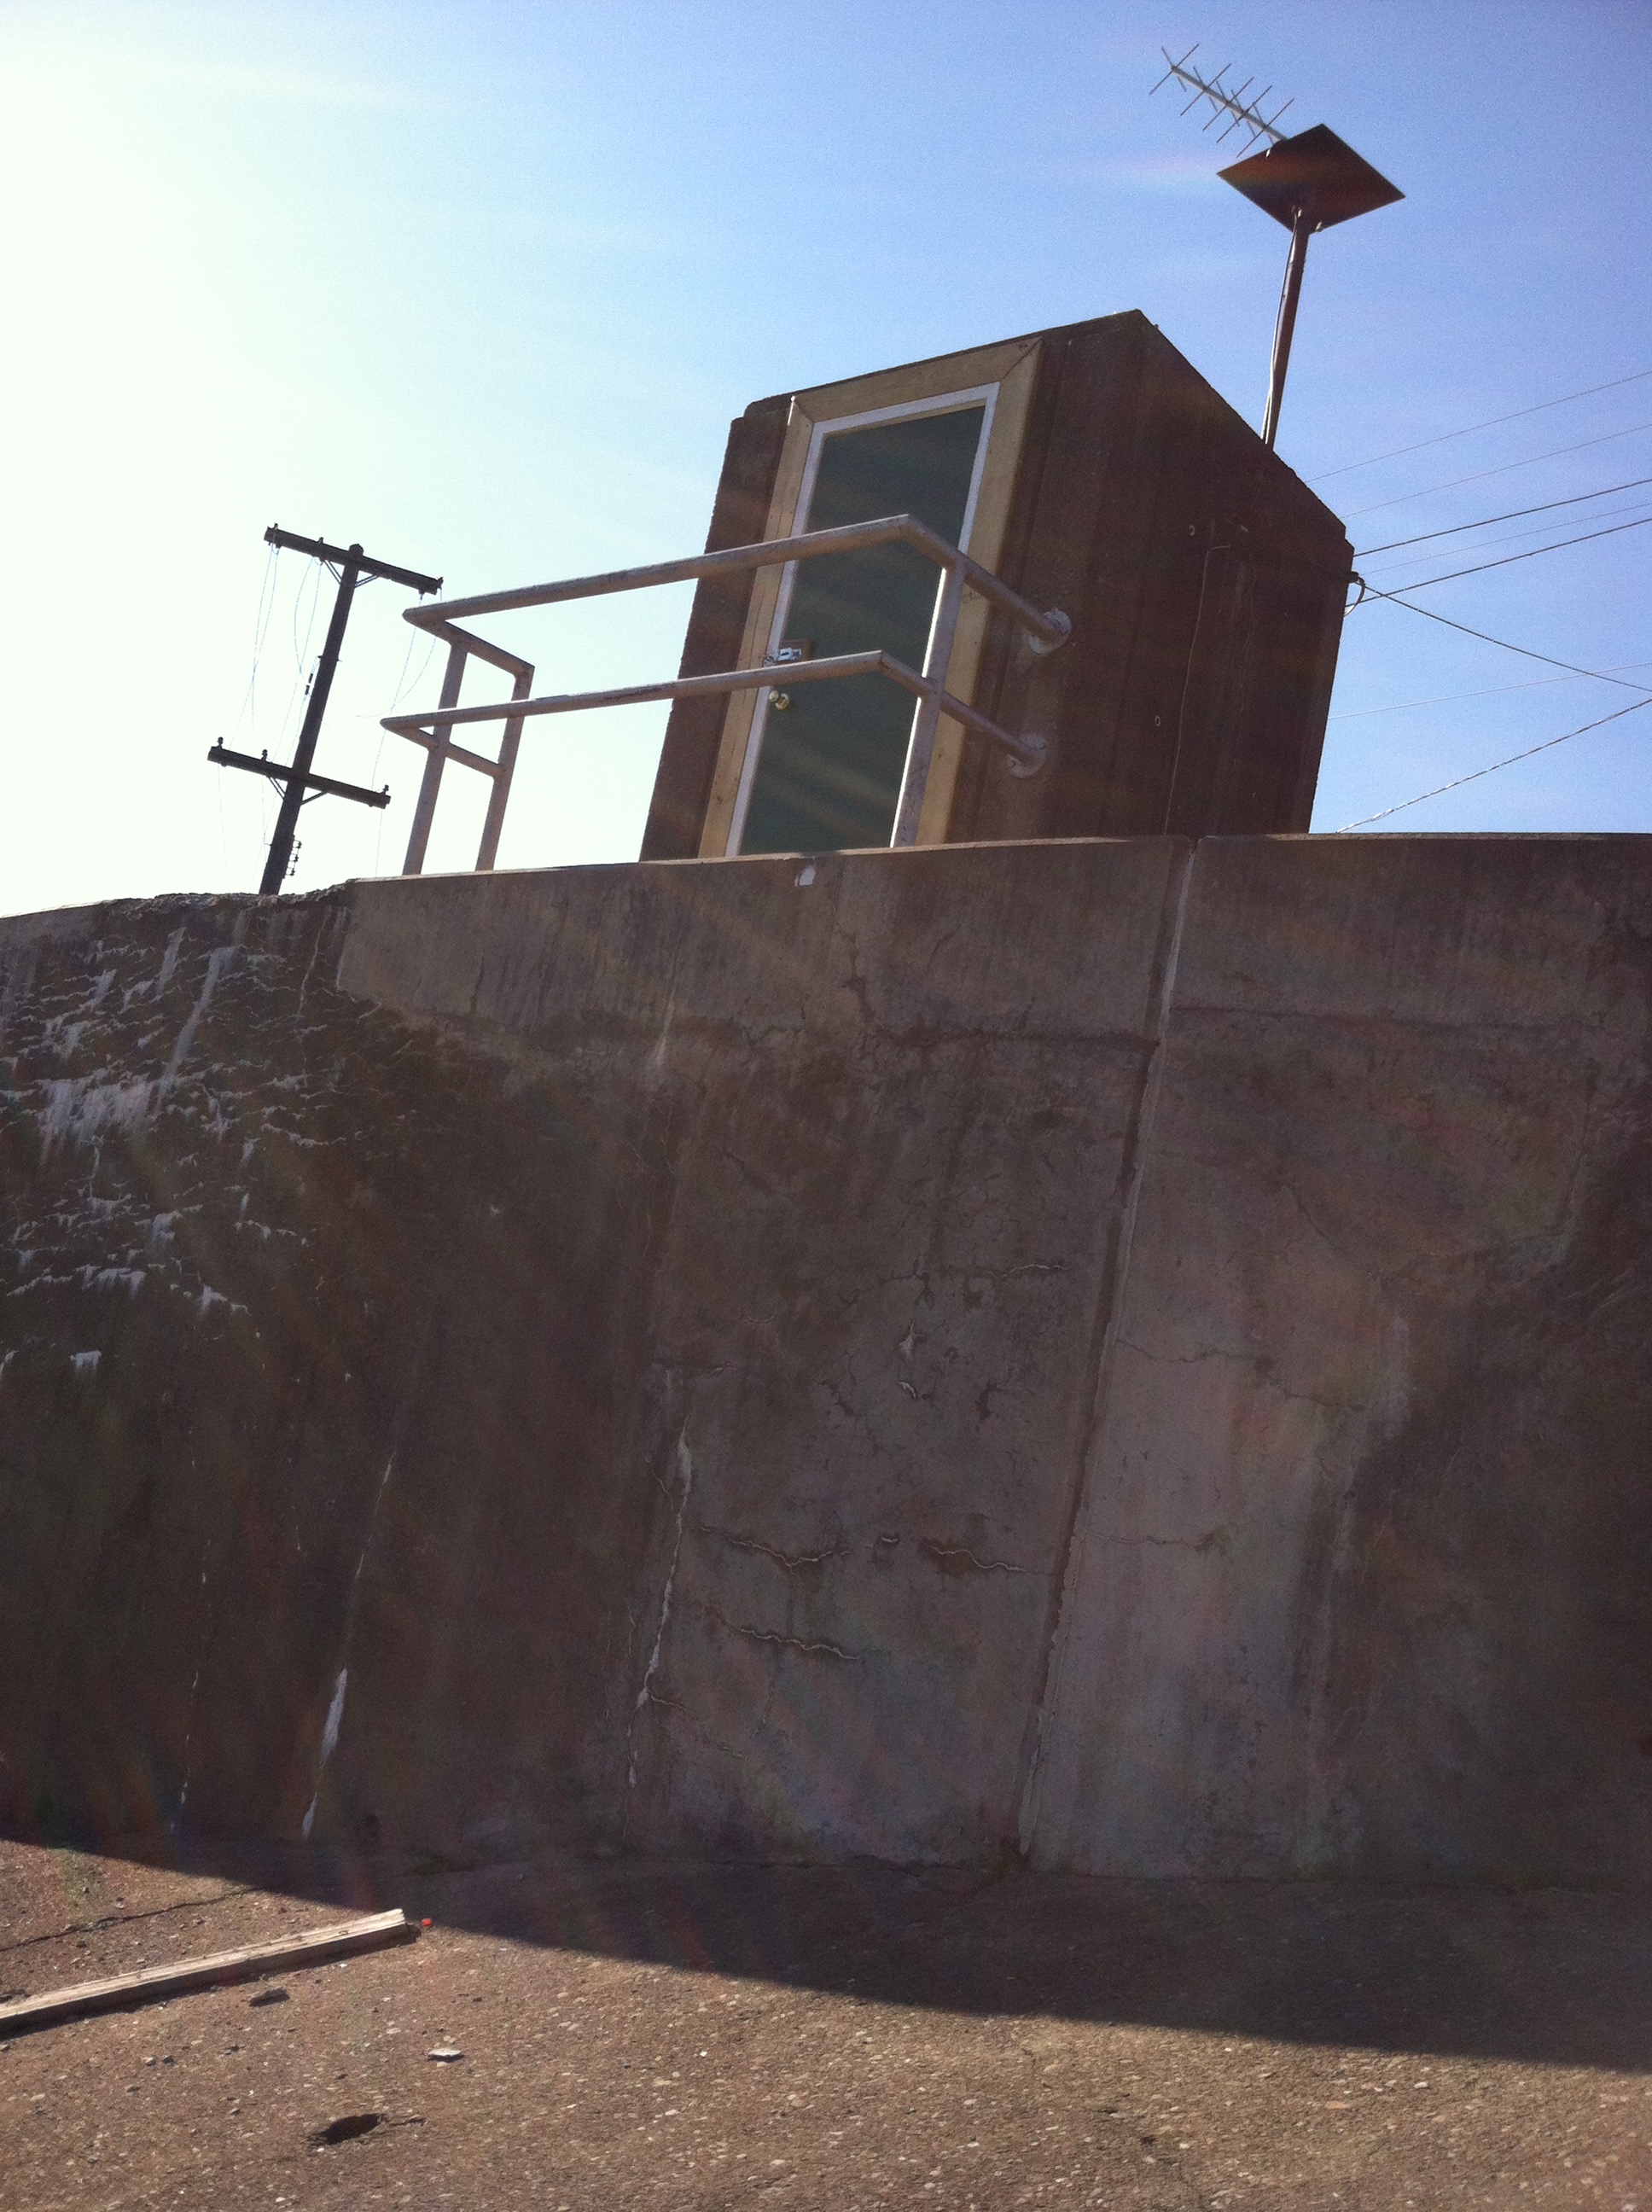 Station image
Summary of all available data for this site
Instantaneous-data availability statement

