PROVISIONAL DATA SUBJECT TO REVISION
Click to hidestation-specific text
Funding for this site is provided by:
 Site Information
LOCATION.--Lat 42°19'50.9", long
79°35'23.7" referenced to North American Datum of
1983, Chautauqua County, NY, Hydrologic Unit 04120101, on left
downstream wingwall of bridge on Hawley Road, 1,400 ft upstream
of Interstate Highway 90, and 1.3 mi from mouth on Lake
Erie.
DRAINAGE AREA.--35 mi².
PERIOD OF RECORD.--August 2017 to current year.
REVISIONS HISTORY.--Discharge for the period Nov. 5, 2017, was revised on Feb. 21, 2024, based on changes to estimated values.
GAGE.--Water-stage recorder and crest-stage gage. Datum of gage is 611.62 ft above NAVD of 1988. Prior to Oct. 1, 2023 at datum 2.00 ft higher.
REMARKS.--Water Years 2017-22: Records fair except those for estimated daily discharges, which are poor.
EXTREMES FOR PERIOD OF RECORD.--Maximum discharge, 6,760 ft³/s, Nov. 5, 2017, gage height, 7.74 ft, present datum; minimum discharge, 1.64 ft³/s, July 15, 2023, gage height, 2.03 ft, present datum; minimum gage height, 1.99 ft, present datum, Sept. 27, 2023.
EXTREMES OUTSIDE PERIOD OF RECORD.--Maximum discharge, 7,730 ft³/s, June 23, 1972, by computation of contracted-opening measurement at site 1 mi downstream (drainage area, 35.6 mi²).
 WaterAlert – get an
email or text (SMS) alert based on your chosen threshold.
WaterAlert – get an
email or text (SMS) alert based on your chosen threshold.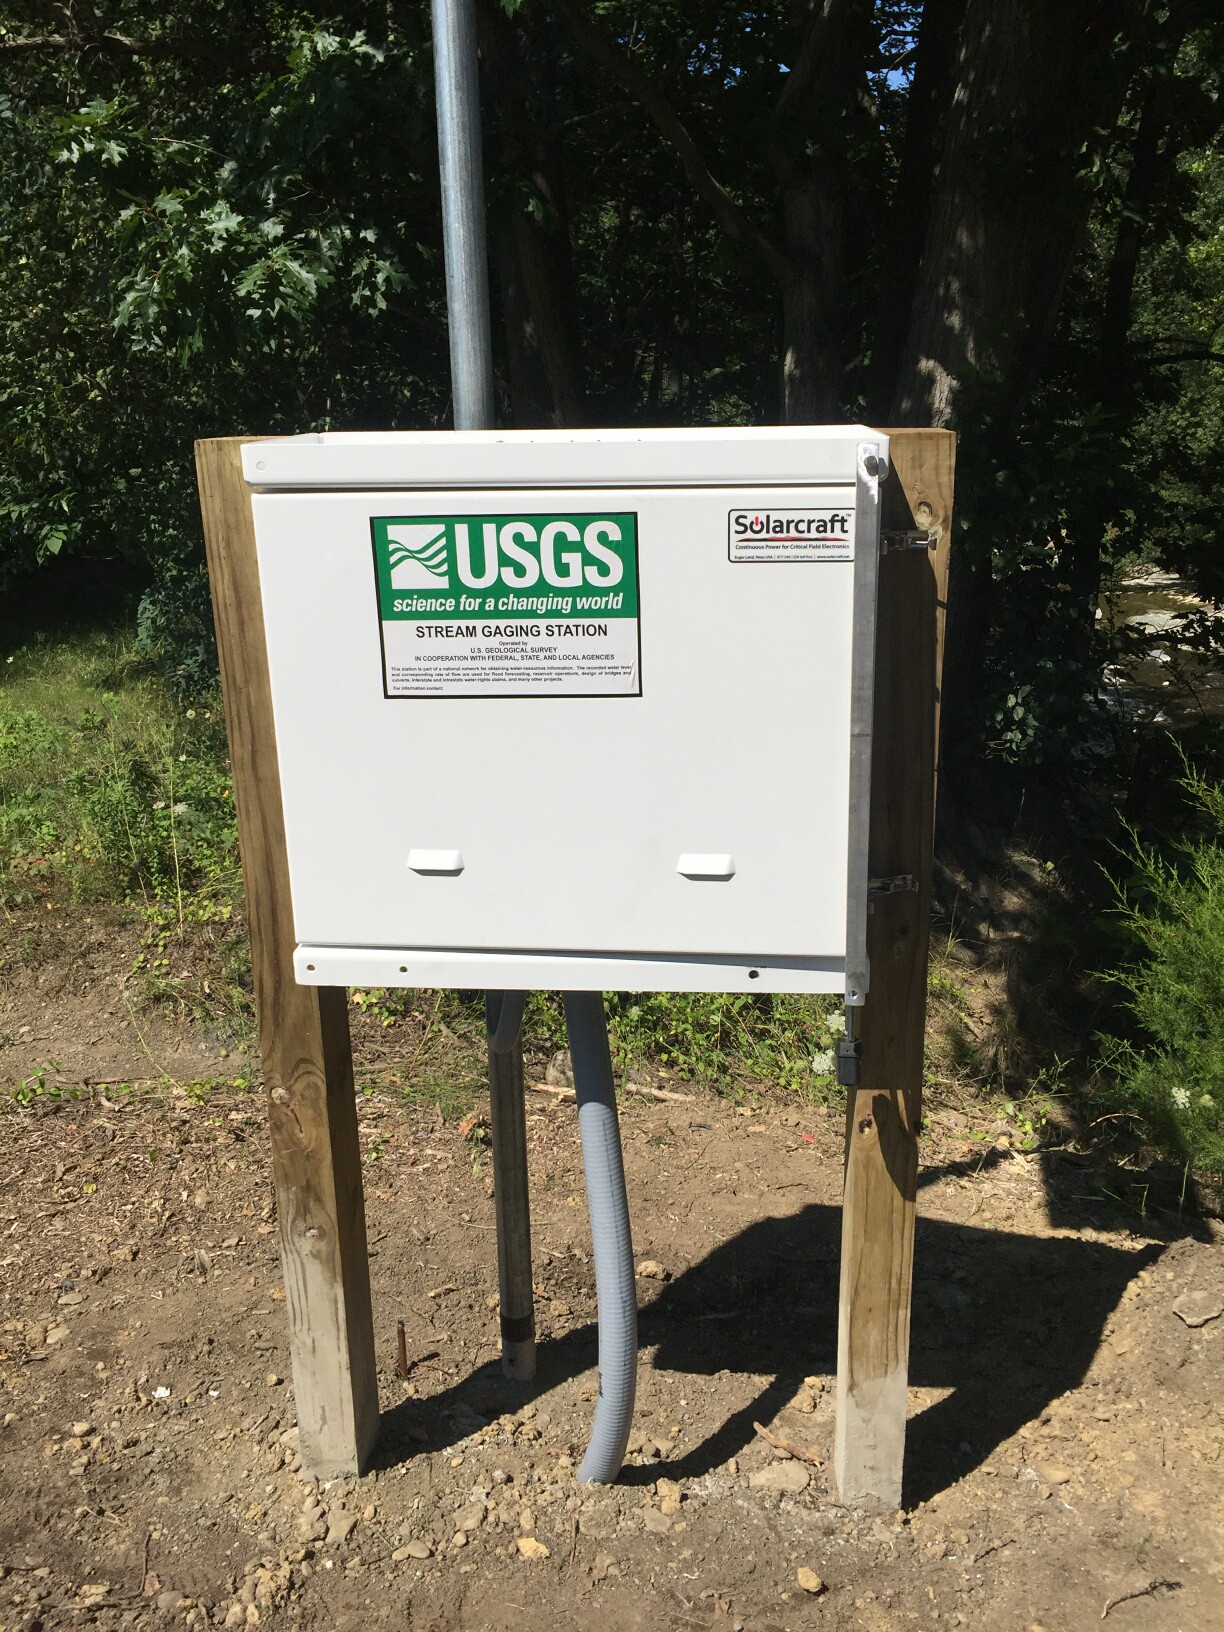 Station image
Summary of all available data for this site
Instantaneous-data availability statement

