PROVISIONAL DATA SUBJECT TO REVISION
Click to hidestation-specific text
Funding for this site is provided by:
 Site Information
LOCATION.--Lat 42°27'12.7", long
78°56'29.6" referenced to North American Datum of
1983, Cattaraugus County, NY, Hydrologic Unit 04120102, on left
bank 0.2 mi upstream from Hill Street bridge in Gowanda, 0.4 mi
upstream from weir, and 1.4 mi upstream from mouth.
DRAINAGE AREA.--6.69 mi².
PERIOD OF RECORD.--June 2021 to current year.
GAGE.--Water-stage recorder and crest-stage gage. Datum of gage is 785.39 ft above NAVD of 1988.
REMARKS.--Water Years 2021-22: Records poor. Water Year 2023: Records fair except those above 500 ft³/s and those for estimated daily discharges, which are poor.
EXTREMES FOR PERIOD OF RECORD.--Maximum discharge, 1,250 ft³/s, Sept. 5, 2022, gage height, 7.54 ft, from rating curve extended above 200 ft³/s; minimum discharge, 1.79 ft³/s, Sept. 23, 27, 28, Oct. 5, 2023, gage height, 3.21 ft.
EXTREMES OUTSIDE PERIOD OF RECORD.--Flood of Aug. 10, 2009 reached a discharge of 7,600 ft³/s, by computation of peak flow by slope-area method. Flood of Aug. 1, 1986 reached a discharge of 3,100 ft³/s, by computation of peak flow by slope-area method.
 WaterAlert – get an
email or text (SMS) alert based on your chosen threshold.
WaterAlert – get an
email or text (SMS) alert based on your chosen threshold.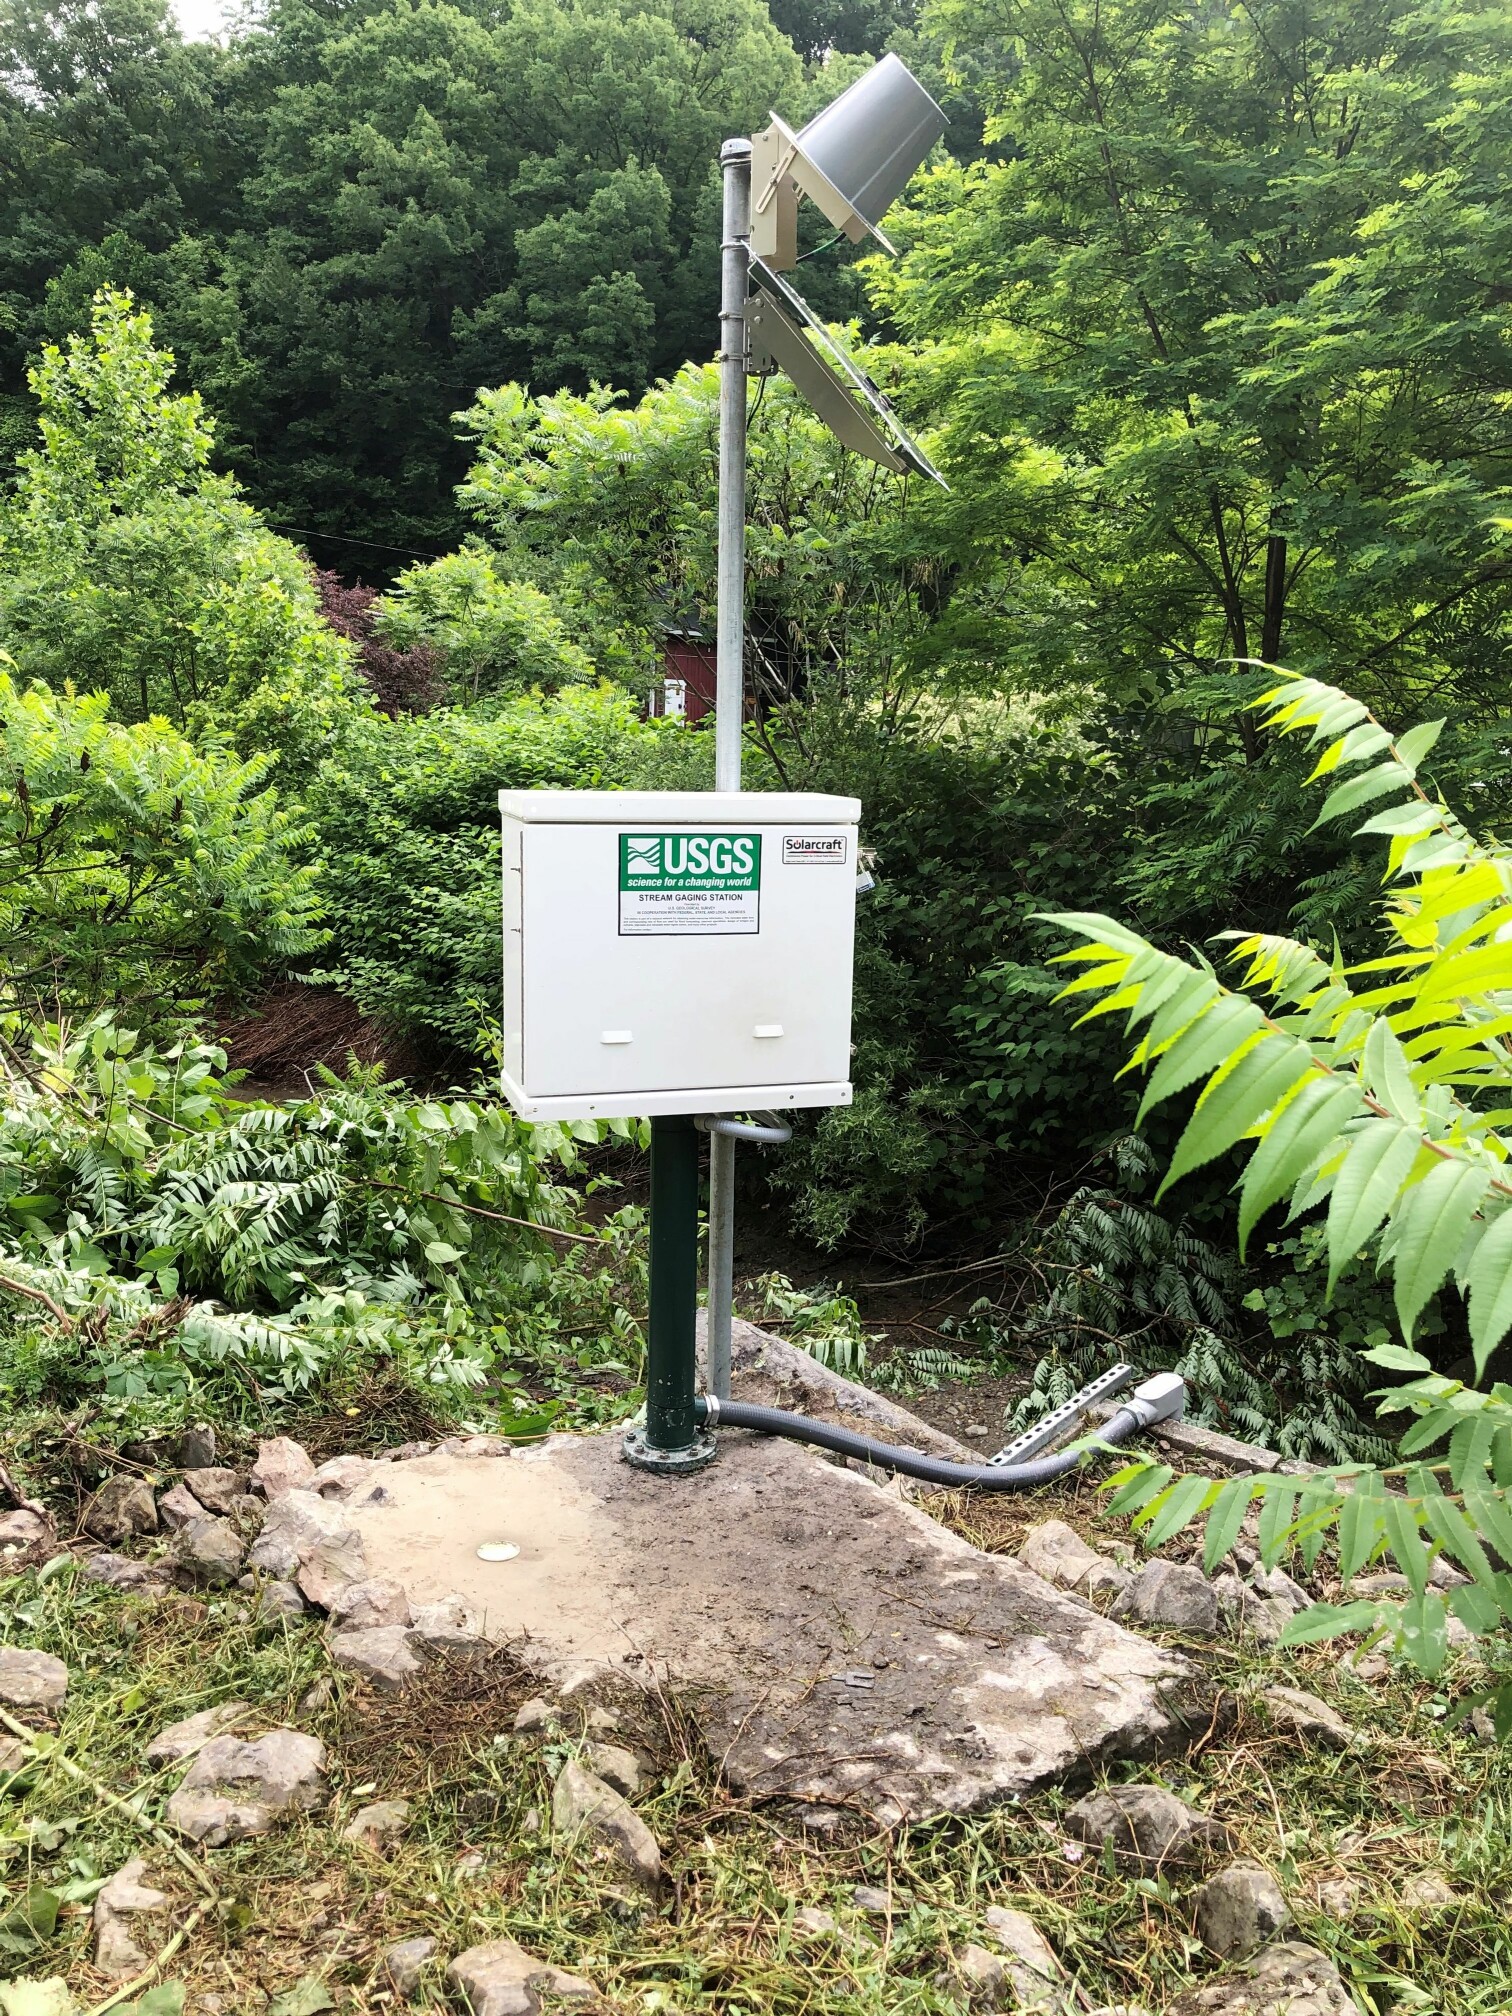 Station image
Summary of all available data for this site
Instantaneous-data availability statement

