PROVISIONAL DATA SUBJECT TO REVISION
Click to hidestation-specific text
Funding for this site is provided by:
 Site Information
LOCATION.--Lat 43°08'30.2", long
77°36'58.7" referenced to North American Datum of
1983, Monroe County, NY, Hydrologic Unit 04130003, on left
bank, adjacent to floodwall, about 400 ft upstream from bridge
on Ford Street, in Rochester.
DRAINAGE AREA.--2,474 mi².
PERIOD OF RECORD.--April 1904 to September 1918, December 1919 to current year. Published as 04231500, "below Erie Canal at Rochester," 1904-18, as 04232000, "at Driving Park Avenue," 1919-68, and "at Rochester," 1969-2005.
GAGE.--Acoustic velocity meter and water-stage recorder. Acoustic velocity meter since 2005. Datum of gage is 498.40 ft above NAVD of 1988, 500.00 ft above Barge Canal datum (furnished), and 498.98 ft above NGVD of 1929 (furnished). April 1904 to December 1910, nonrecording gage, and December 1910 to September 1918, water-stage recorder, at site 1.9 mi upstream at datum 506.85 ft, Barge Canal datum. December 1919 to Apr. 4, 1927 (in Rochester Gas & Electric Corporation power plant), and Apr. 4, 1927 to June 19, 1956, at site 3.1 mi downstream, at datum 250.00 ft above NGVD of 1929. June 20, 1956 to Sept. 30, 1969, at site 3.1 mi downstream at datum 247.00 ft above NGVD of 1929. Oct. 1, 1969 to Sept. 30, 1985, at site 3.1 mi downstream at datum 246.24 ft above NGVD of 1929. Oct. 1, 1985 to Sep. 30, 2005, at site 3.1 mi downstream at datum 244.24 ft above NGVD of 1929 (245.00 ft Barge Canal datum). Oct. 1, 2005 to Mar. 31, 2019, at datum 1.08 ft below NGVD of 1929 (at Barge Canal datum).
REMARKS.--Occasional fluctuation caused by powerplant downstream from station. New York State Erie (Barge) Canal crosses river 1.8 mi upstream from station. Water diverted by the canal from Niagara River basin is discharged into river from the west, the canal again diverting a smaller amount of water from river to the east. Additional regulation to some extent by Rushford Lake from July 1928 to November 1951, at high flows by Mount Morris Lake (station 04224000) since November 1951, and by Conesus Lake (station 04227980).
Water Year 2014: Records good except those below 800 ft³/s, which are fair, and those for estimated daily discharges, which are poor.
Water Years 2015-24: Records fair except those for estimated daily discharges and daily discharges below 2,000 ft³/s, which are poor.
EXTREMES FOR PERIOD OF RECORD.--Maximum discharge, since construction of Mt. Morris Reservoir in 1951, 29,600 ft³/s, June 25, 1972, gage height, 15.89 ft, site and datum then in use. Since water year 2006, maximum and minimum instantaneous discharges not determined. Maximum daily discharge, since construction of Mt. Morris Reservoir in 1951, 24,900 ft³/s, June 25, 26, 1972; maximum gage height, since January 2005, 14.34 ft, present datum, Mar. 13, 2014; minimum daily discharge, 76 ft³/s, July 27, 2016.
EXTREMES OUTSIDE PERIOD OF RECORD.--Maximum discharge, about 54,000 ft³/s, Mar. 18, 1865.
EXTREMES FOR PERIOD PRIOR TO REGULATION.--Maximum discharge, prior to construction of Mt. Morris Reservoir in 1951, 48,300 ft³/s, Mar. 30, 1916, gage height, 15.3 ft, site and datum then in use; minimum discharge (at gage site located 3.1 mi downstream), less than 10 ft³/s, occurred during low-flow periods in some years when power plant was shut down.
PERIOD OF DAILY RECORD1.-- WATER TEMPERATURE: December 2010 to current year. SPECIFIC CONDUCTANCE: December 2010 to current year. pH: December 2010 to current year. DISSOLVED OXYGEN: December 2010 to current year. TURBIDITY: December 2010 to current year.
INSTRUMENTATION1.--Multi-parameter water-quality sonde measures water temperature, specific conductance, pH, dissolved oxygen, and turbidity at 15-minute intervals since December 2010.
COOPERATION1.--In cooperation with the U.S. Environmental Protection Agency's Great Lakes Restoration Initiative (GLRI).
EXTREMES FOR PERIOD OF DAILY RECORD1.--
WATER TEMPERATURE: Maximum, 29.9°C, July 24, 2011; minimum, -0.1°C, on many days.
SPECIFIC CONDUCTANCE: Maximum, 1,250 uS/cm @ 25°C, Mar. 12, 2015; minimum, 232 uS/cm @ 25°C, July 30, 2018.
pH: Maximum, 8.7, July 12, 2018; minimum, 7.3, Sept. 2, 5, 7, 2012.
DISSOLVED OXYGEN: Maximum, 15.8 mg/L, Aug. 19, 2015; minimum, 2.8 mg/L, June 30, 2016.
TURBIDITY: Maximum, 1,560 FNU, July 16, 2015; minimum, 1.4 FNU, Oct. 16, 2014.
1 Water-Quality Records
 WaterAlert – get an
email or text (SMS) alert based on your chosen threshold.
WaterAlert – get an
email or text (SMS) alert based on your chosen threshold.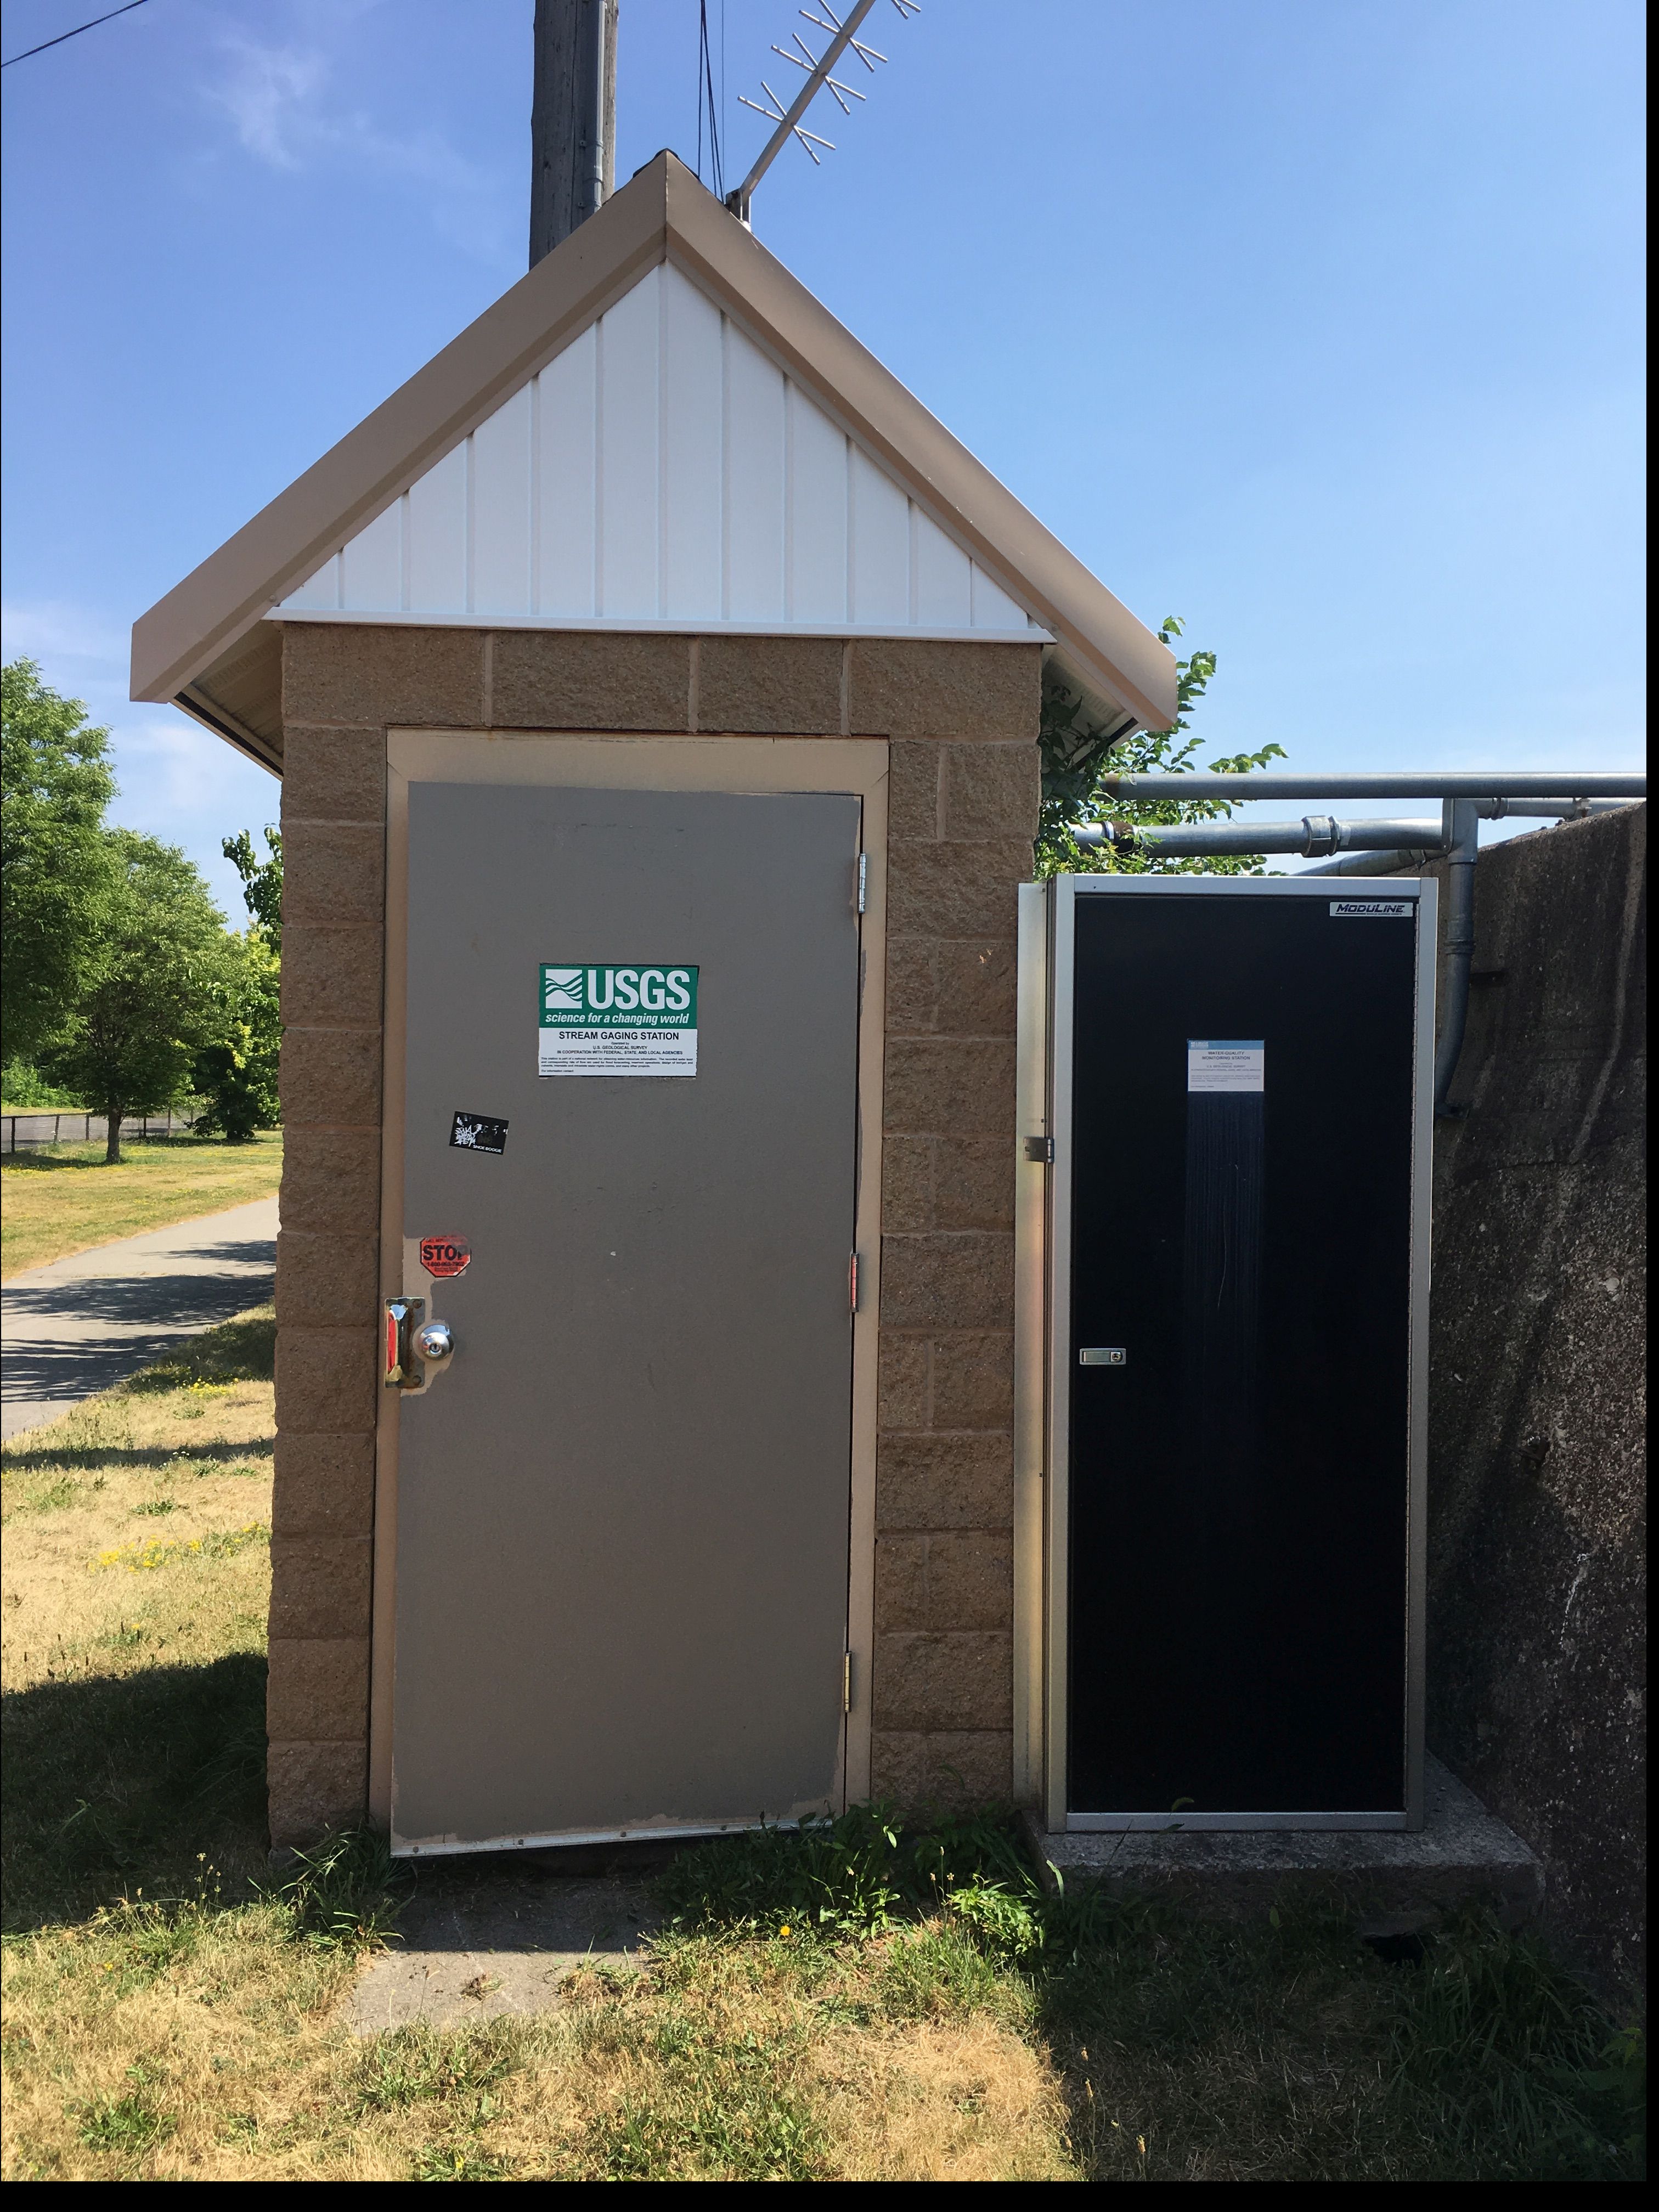 Station image
Summary of all available data for this site
Instantaneous-data availability statement


