PROVISIONAL DATA SUBJECT TO REVISION
Click to hidestation-specific text
Funding for this site is provided by:
 Site Information
LOCATION.--Lat 43°04'43", long
76°38'44" referenced to North American Datum of 1983,
Cayuga County, NY, Hydrologic Unit 04140201, on right bank 50
ft upstream from State Highway 38 bridge, 3.0 mi north of Port
Byron, and 10.1 mi upstream from Cross Lake.
DRAINAGE AREA.--2,815 mi².
PERIOD OF RECORD.--August 1996 to current year.
REVISIONS HISTORY.--Discharge for the periods Mar. 29, 2017 to Apr. 1, 2017 and Apr. 22, 2017 to May 1, 2017, was revised on Mar. 21, 2018, based on changes to the stage-discharge rating.
GAGE.--Acoustic velocity meter, water-stage recorder, and crest-stage gage. Datum of gage is 369.00 ft above NAVD of 1988. Prior to Apr. 1, 2019, at datum 70.00 ft lower.
COOPERATION.--Records of gate openings, lockages, and elevations of water surface in Erie (Barge) Canal above and below Lock 24 & 25, furnished by New York State Thruway Authority, Office of Canals.
REMARKS.--A large amount of natural storage and some artificial regulation is afforded by many large lakes and the Erie (Barge) Canal system in the river basin. Seneca River basin receives water from Erie (Barge) Canal through Lock 32 near Pittsford. Prior to 1998, a large part of flow from 45.5 mi² of Mud Creek drainage area (Susquehanna River basin) had been diverted into Keuka Lake (Oswego River basin) for power generation.
Water Years 2014-23: Records good except those for estimated daily discharges, which are fair.
EXTREMES FOR PERIOD OF RECORD.--Maximum daily discharge, 13,600 ft³/s, Jan. 11, 1998; minimum daily discharge, 216 ft³/s, Nov. 26, 2020, Oct. 25, 2022. Maximum and minimum instantaneous discharges not determined.
 WaterAlert – get an
email or text (SMS) alert based on your chosen threshold.
WaterAlert – get an
email or text (SMS) alert based on your chosen threshold.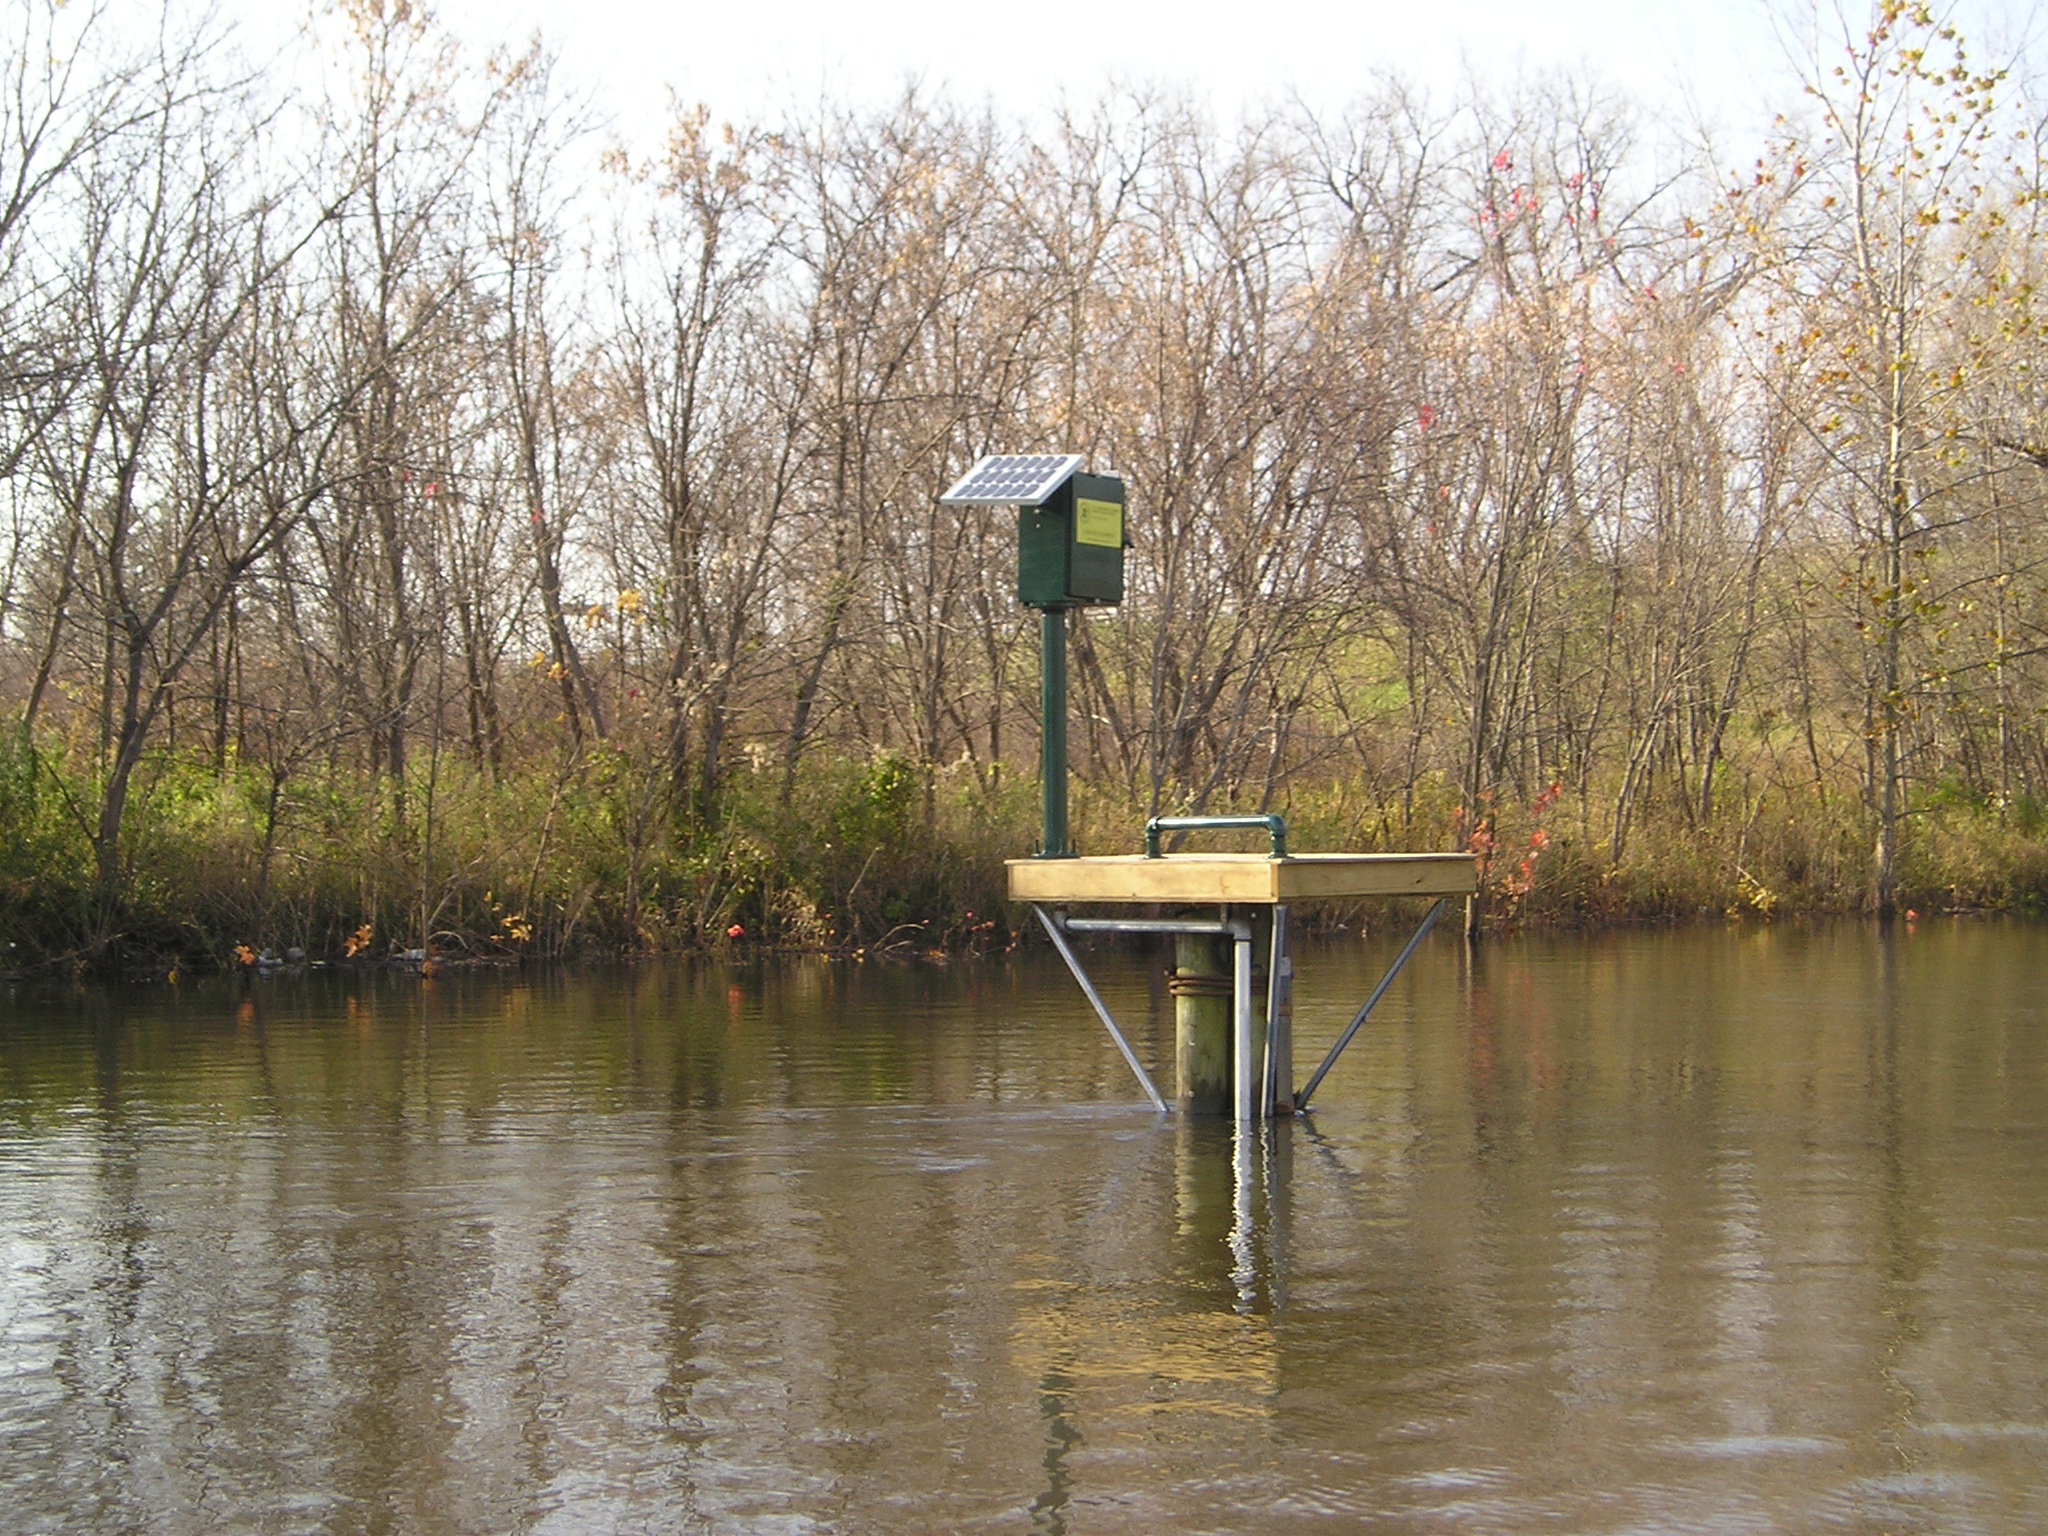 Station image
Summary of all available data for this site
Instantaneous-data availability statement

![Graph of Gage height, feet, [PrimaryGH]](https://natwebcaww02.wr.usgs.gov/nwisweb/data/img/USGS.04235600.107678.00065..20240318.20240418..0..gif)

![Graph of Mean water velocity for discharge computation, feet per second, [Range Average MWV]](https://natwebcaww02.wr.usgs.gov/nwisweb/data/img/USGS.04235600.269723.72255..20240318.20240418..0..gif)