PROVISIONAL DATA SUBJECT TO REVISION
Click to hidestation-specific text
Funding for this site is provided by:
 Site Information
LOCATION.--Lat 43°09'44.4", long
76°21'45.7" referenced to North American Datum of
1983, Onondaga County, NY, Hydrologic Unit 04140201, on left
bank at downstream side of bridge on State Highway 690 and 1.6
mi upstream from Baldwinsville.
DRAINAGE AREA.--3,130 mi².
PERIOD OF RECORD.--November 1949 to current year. November 1898 to December 1908, prior to construction of Erie (Barge) Canal, not equivalent to later records because of extensive development of Erie (Barge) Canal system. January 1909 to September 1925 (gage heights only) in reports of State Engineer and Surveyor. Prior to October 2014, published as "at Baldwinsville" (04237500).
GAGE.--Acoustic velocity meter and water-stage recorder. Datum of gage is 370.00 ft above NAVD of 1988. Prior to Apr. 1, 2019, at datum 70.00 ft lower. Prior to October 2014, base water-stage recorder at site 1.6 mi downstream and, prior to October 1996, auxiliary water-stage recorder at site 1,500 ft downstream from base gage at datum 360.80 ft above NAVD of 1988 (VERTCON), 361.38 ft above NGVD of 1929, and 362.60 ft above Erie (Barge) Canal Datum. Prior to Dec. 31, 1908, nonrecording gage at site 1.6 mi downstream at different datum.
COOPERATION.--New York State Canal Corporation.
REMARKS.--Records from November 1898 to December 1908 determined on basis of head on dam, flow through 10 mills nearby, lockages at Oswego Canal lock, estimated leakage of dam, wheel gates, flumes, and penstocks; not adjusted for inflow from Lake Erie through Erie (Barge) Canal. Records from November 1949 to September 1996, computed by using fall as determined by auxiliary water-stage recorder. Records from October 1996 to September 2014, computed by using standard stage-discharge methods. Low and medium flows from November 1949 to September 2014, affected by large diurnal fluctuations caused by powerplants upstream from station at site then in use. Published record, November 1949 to September 2014, represents the total flow at Baldwinsville and includes flow in Erie (Barge) Canal. Low and medium flows at present site can be affected by operation of powerplants and Lock 24 on Erie (Barge) Canal 1.6 mi downstream from gage. Seneca River basin receives water from Erie (Barge) Canal through Lock 32 near Pittsford. A large amount of natural storage and some artificial regulation is afforded by many large lakes and the Erie (Barge) Canal system in the river basin. From 1931-98, a large part of flow from 45.5 mi² of Mud Creek drainage area (Susquehanna River basin) had been diverted into Keuka Lake (Oswego River basin) for power generation.
Water Years 2014-23: Records good except those for estimated daily discharges, which are poor.
EXTREMES FOR PERIOD OF RECORD.--Maximum daily discharge, 18,100 ft³/s, Apr. 27, 1993; minimum daily discharge, 34 ft³/s, Sept. 17, 1985, result of extreme regulation. Maximum and minimum instantaneous discharges not determined. Maximum instantaneous gage height for the period November 1949 to September 2014, 9.63 ft, Apr. 26, 27, 1993, site and datum then in use; for the period Oct. 1, 2014 to present, 5.98 ft, Oct. 31, Nov. 1, 2021. Minimum instantaneous gage height not determined.
EXTREMES OUTSIDE PERIOD OF RECORD.--Maximum daily discharge, 22,100 ft³/s, Mar. 25, 1936, provided by New York State Department of Transportation.
 WaterAlert – get an
email or text (SMS) alert based on your chosen threshold.
WaterAlert – get an
email or text (SMS) alert based on your chosen threshold.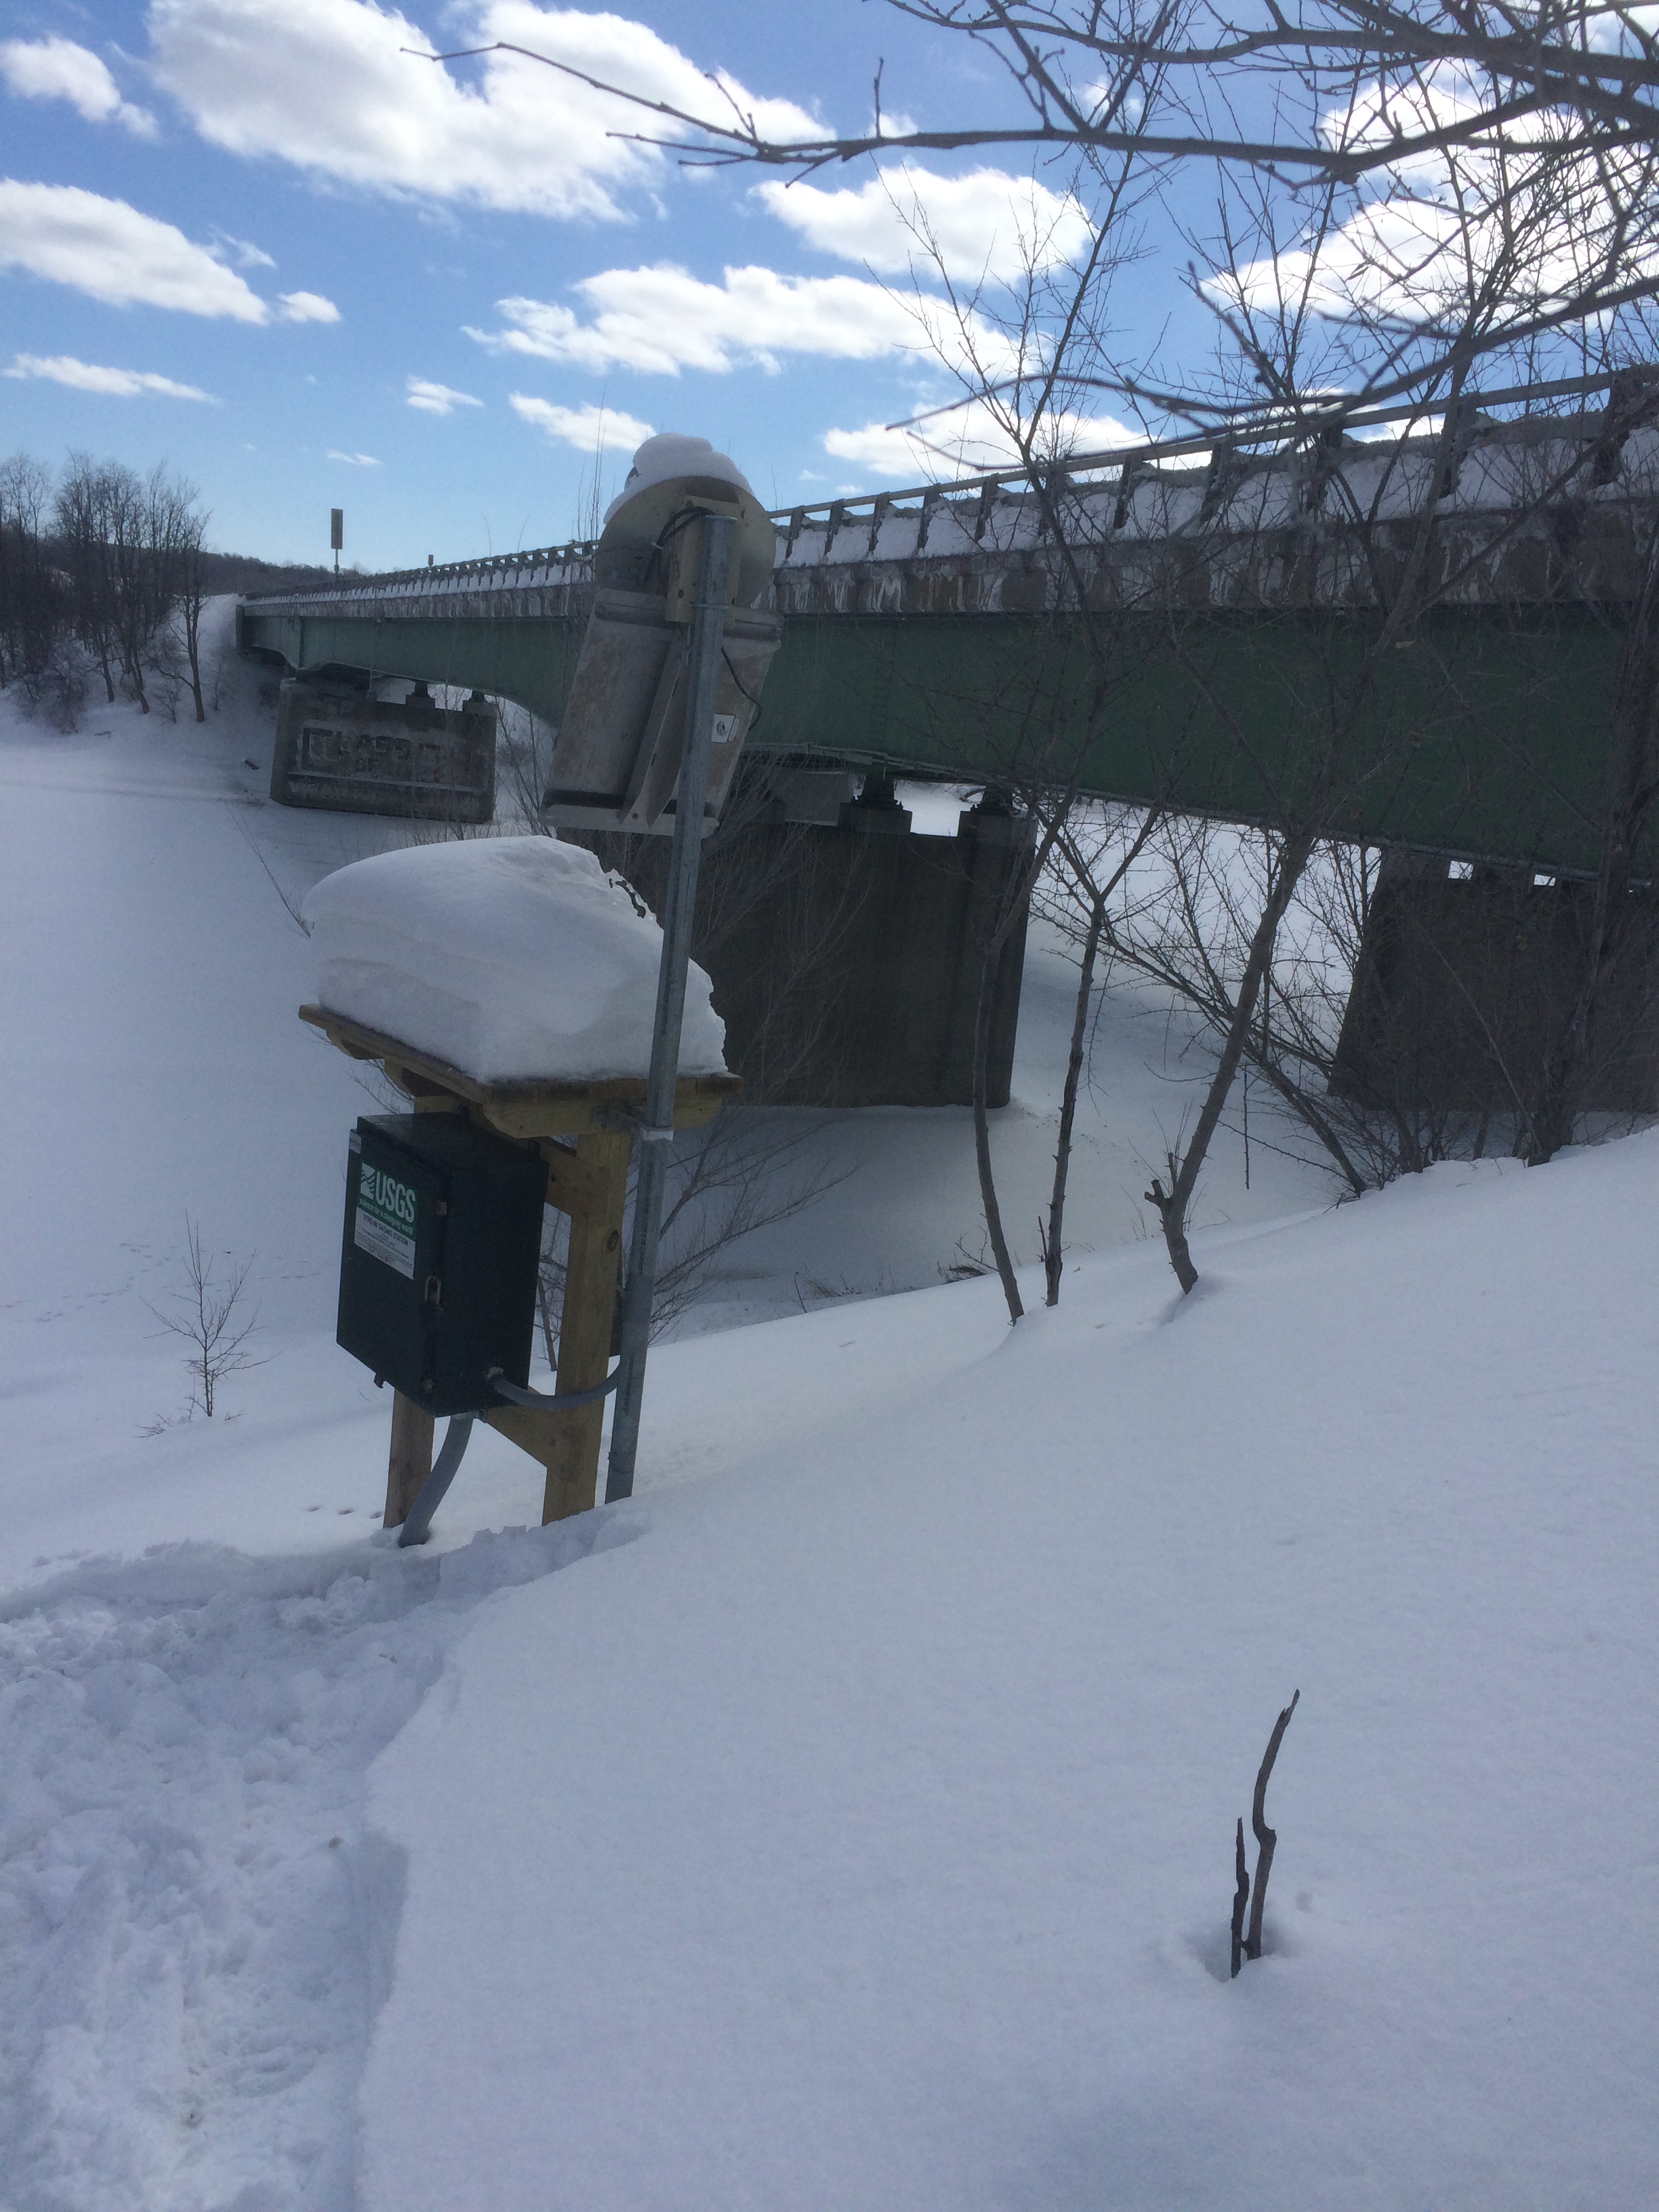 Station image
Summary of all available data for this site
Instantaneous-data availability statement


