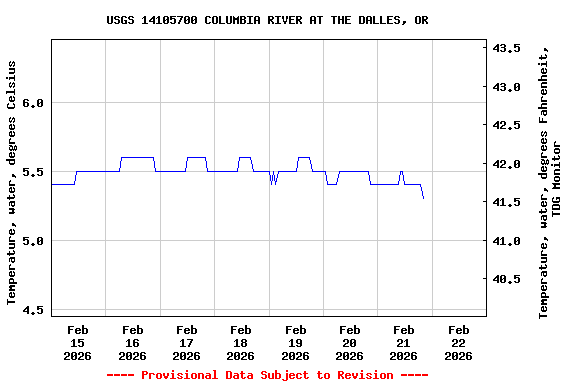
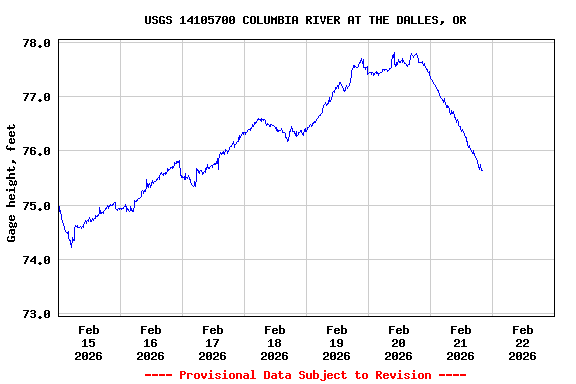
Most recent instantaneous value: 5.3 02-21-2026 20:00 PST
See this graph on the Monitoring Location Pages
Station operated in cooperation with the U.S. Army Corps of Engineers and funded by the U.S. Geological Survey National Streamflow Information Program (NSIP).
| Boating safety tips |
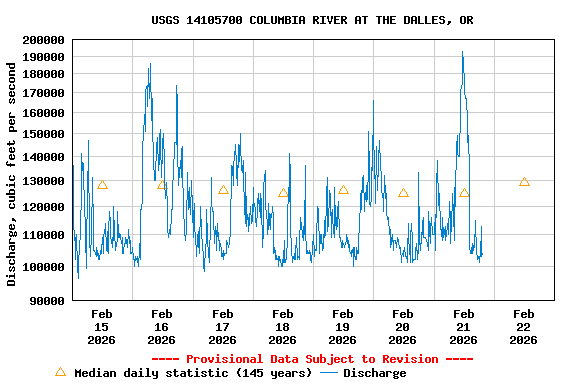
| Min (1937) | 25th percen- tile | Most Recent Instantaneous Value Feb 22 | Median | Mean | 75th percen- tile | Max (1996) |
|---|---|---|---|---|---|---|
| 52800 | 90600 | 120000 | 129000 | 136000 | 165000 | 370000 |
![Graph of Mean water velocity for discharge computation, feet per second, [from Channel Master]](https://natwebcaww02.wr.usgs.gov/nwisweb/data/img/USGS.14105700.308748.72255..20260215.20260222..0..gif)
![]() U.S. Department of the Interior |
U.S. Geological Survey
U.S. Department of the Interior |
U.S. Geological Survey
Title: USGS Current Conditions for Oregon
URL:
Page Contact Information: Oregon Water Data Support Team
Page Last Modified: 2026-02-22 00:08:46 EST
3.19 2.29 caww02