Warning: Javascript must be enabled to use all the features on this page!
Page Loading - Please Wait...
- Explore the NEW USGS National Water Dashboard interactive map to access real-time water data from over 13,500 stations nationwide.
-
Full News

Click to hide state-specific text
- Webcams are available at the following streamgages in Pennsylvania: 01465500 | 01473000 | 01474500 | 01480870 | 01481000 | 01531500 | 01553500 | 03020500 | 03025500
- Sign up for custom Water Alerts by text or email.
![[!]](https://pa.water.usgs.gov/images/exclaim.gif) Over the
next year, the USGS Pennsylvania Water Science Center will be updating
the geodetic vertical elevation (gage datum) for many locations. Click
HERE for additional information including a current list of
streamgages with upcoming datum changes. This update in gage datum does
not affect the location of the streamgage, nor the observed local gage
height or discharge recorded at the streamgage.
Over the
next year, the USGS Pennsylvania Water Science Center will be updating
the geodetic vertical elevation (gage datum) for many locations. Click
HERE for additional information including a current list of
streamgages with upcoming datum changes. This update in gage datum does
not affect the location of the streamgage, nor the observed local gage
height or discharge recorded at the streamgage.
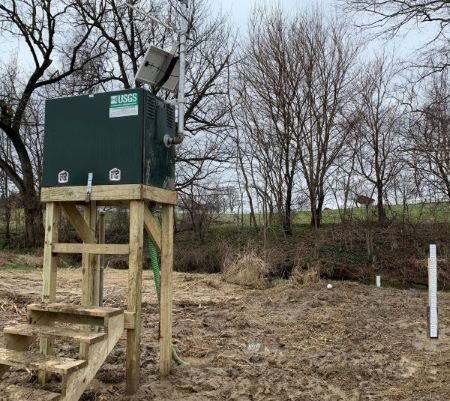 STATION.--015765195 BIG SPRING RUN NEAR MYLIN
CORNERS, PA
STATION.--015765195 BIG SPRING RUN NEAR MYLIN
CORNERS, PA