USGS 01467048 Pennypack Cr at Lower Rhawn St Bdg, Phila., PA

PROVISIONAL DATA SUBJECT TO REVISION

Click to hidestation-specific text


Station gage imageSTATION.--01467048 PENNYPACK CREEK AT LOWER RHAWN STREET BRIDGE, PHILADELPHIA, PA
LOCATION.--Lat 40`03'00", long 75`01'59", Philadelphia County, Hydrologic Unit 02040202, on left bank at downstream side of footbridge pier, 400 ft downstream from Lower Rhawn Street bridge, and 0.8 mi upstream from Wooden Bridge Run in Philadelphia.
DRAINAGE AREA.--49.8 square miles.
PERIOD OF RECORD.--June 1965 to current year. Records for 1971-74 published in WDR PA-81-1.
REVISED RECORDS.--WDR PA-81-1: 1974. WDR PA-89-1: 1988.
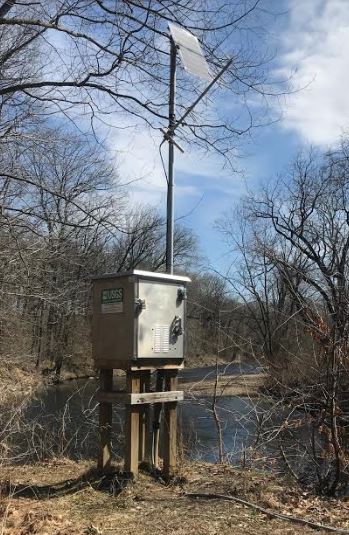
GAGE.--Water-stage recorder and water-quality monitor. Datum of gage is 21.2 ft. above North American Vertical Datum of 1988, (GNSS survey). Prior to April 8, 2024, the datum of gage was erroneously reported as 21.27 ft above National Geodetic Vertical Datum of 1929. Satellite telemetry at station.
COOPERATION.--Station established and maintained by the U.S. Geological Survey. Funding for the operation of this station is provided by the City of Philadelphia, Water Department and the U.S. Geological Survey.
REMARKS.-- Calibration of water-quality instrumentation is conducted exclusively by Philadelphia Water Department personnel with USGS oversight. Erroneous or missing data, resulting from instrument malfunction, are not the responsibility of USGS.
GAGE HEIGHTS OF IMPORTANCE.-
Supplied by USGS: Data transmitter operational limit - 15.8 ft;
Supplied by NWS: Flood stage-7 ft; Moderate flood stage-9 ft; Major flood stage-11 ft.
This station managed by the PAWSC Downingtown Field Office.

Available Parameters Available Period
  
2024-02-29  2024-04-16
1990-10-01  2024-04-16
2007-10-01  2024-04-16
2024-02-29  2024-04-16
2024-02-29  2024-04-16
2024-02-29  2024-04-16
2024-02-29  2024-04-16
2021-10-01  2024-04-16
2021-04-17  2024-04-16


 (7)
 

  -- or --


Summary of all available data for this site
Instantaneous-data availability statement


Temperature, water, degrees Celsius

Most recent instantaneous value: 17.8 04-16-2024   19:00 EDT
Graph of

Add up to 2 more sites and replot for "Temperature, water, degrees Celsius"

?


Create presentation-quality / stand-alone graph.   Subscribe to WaterAlert      

See this graph on the Monitoring Location Pages


Discharge, cubic feet per second

Most recent instantaneous value: 86.7 04-16-2024   19:00 EDT
Graph of

Add up to 2 more sites and replot for "Discharge, cubic feet per second"

?


Create presentation-quality / stand-alone graph.   Subscribe to WaterAlert      

See this graph on the Monitoring Location Pages


Daily discharge, cubic feet per second -- statistics for Apr 16 based on 56 water years of record more
Min
(1966)
25th
percen-
tile
Median Most Recent
Instantaneous
Value Apr 16
75th
percen-
tile
Mean Max
(2007)
28.0 52 77 86.7 153 242 2400


Gage height, feet

Most recent instantaneous value: 3.03 04-16-2024   19:00 EDT
Graph of

Add up to 2 more sites and replot for "Gage height, feet"

?


Create presentation-quality / stand-alone graph.   Subscribe to WaterAlert      

See this graph on the Monitoring Location Pages


Specific conductance, water, unfiltered, microsiemens per centimeter at 25 degrees Celsius

Most recent instantaneous value: 496 04-16-2024   19:00 EDT
Graph of

Add up to 2 more sites and replot for "Specific conductance, water, unfiltered, microsiemens per centimeter at 25 degrees Celsius"

?


Create presentation-quality / stand-alone graph.   Subscribe to WaterAlert      

See this graph on the Monitoring Location Pages


Dissolved oxygen, water, unfiltered, milligrams per liter

Most recent instantaneous value: 10.3 04-16-2024   19:00 EDT
Graph of

Add up to 2 more sites and replot for "Dissolved oxygen, water, unfiltered, milligrams per liter"

?


Create presentation-quality / stand-alone graph.   Subscribe to WaterAlert      

See this graph on the Monitoring Location Pages


Dissolved oxygen, water, unfiltered, percent of saturation

Most recent instantaneous value: 109 04-16-2024   19:00 EDT
Graph of

Add up to 2 more sites and replot for "Dissolved oxygen, water, unfiltered, percent of saturation"

?


Create presentation-quality / stand-alone graph.   Subscribe to WaterAlert      

See this graph on the Monitoring Location Pages


pH, water, unfiltered, field, standard units

Most recent instantaneous value: 7.9 04-16-2024   19:00 EDT
Graph of

Add up to 2 more sites and replot for "pH, water, unfiltered, field, standard units"

?


Create presentation-quality / stand-alone graph.   Subscribe to WaterAlert      

See this graph on the Monitoring Location Pages


Stream water level elevation above NAVD 1988, in feet

Most recent instantaneous value: 24.23 04-16-2024   19:00 EDT
Graph of

Add up to 2 more sites and replot for "Stream water level elevation above NAVD 1988, in feet"

?


Create presentation-quality / stand-alone graph.   Subscribe to WaterAlert      

See this graph on the Monitoring Location Pages


Turbidity, water, unfiltered, monochrome near infra-red LED light, 780-900 nm, detection angle 90 +-2.5 degrees, formazin nephelometric units (FNU)

Most recent instantaneous value: 1.7 04-16-2024   19:00 EDT
Graph of

Add up to 2 more sites and replot for "Turbidity, water, unfiltered, monochrome near infra-red LED light, 780-900 nm, detection angle 90 +-2.5 degrees, formazin nephelometric units (FNU)"

?


Create presentation-quality / stand-alone graph.   Subscribe to WaterAlert      

See this graph on the Monitoring Location Pages