USGS 01542500 WB Susquehanna River at Karthaus, PA

PROVISIONAL DATA SUBJECT TO REVISION

Click to hidestation-specific text


Station gage imageSTATION.--01542500 WEST BRANCH SUSQUEHANNA RIVER AT KARTHAUS, PA
LOCATION.--Lat 41`07'03", long 78`06'33", Clearfield County, Hydrologic Unit 02050201, on left bank 900 ft upstream from bridge on State Highway 879 at Karthaus, 1,000 ft upstream from Mosquito Creek, and 3.3 mi downstream from Moshannon Creek. Records include flow of Mosquito Creek.
DRAINAGE AREA.--1,462 square miles, includes that of Mosquito Creek.
PERIOD OF RECORD.--October 2004 to current year. October 1918 to September 1920 (gage heights only); February 1940 to September 1995; October 1995 to September 2004 (annual maximum only);
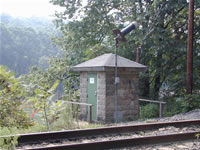
GAGE.--Water-stage recorder, crest-stage gage, and water-quality monitor. Datum of gage is 830.06 ft above North American Vertical Datum of 1988. Prior to Sept. 30, 1920, non-recording gage at site 900 ft downstream at datum 20.88 ft lower. Feb. 21 to Sept. 30, 1940, non-recording gage at site 900 ft downstream at present datum. Prior to October 3, 2023, the datum of gage was reported as 830.59 ft above National Geodetic Vertical Datum of 1929. Satellite telemetry at station.
COOPERATION.--Funding for the operation of this station is provided by the Pennsylvania Department of Environmental Protection and the U.S. Geological Survey.
GAGE HEIGHTS OF IMPORTANCE.-
Supplied by USGS: Data transmitter operational limit - 27.3 ft;
Supplied by NWS: Action stage-16 ft; Flood stage-19 ft, the left, or west bank overflows; Moderate flood stage-22 ft, several homes in low lying areas near Mosquito Creek are affected; Major flood stage-24 ft, a number of homes are affected by high water.
This station managed by the PAWSC Williamsport Field Office.

Available Parameters Available Period
  
2010-11-11  2024-04-15
1985-10-01  2024-04-15
2007-10-01  2024-04-15
2010-11-11  2024-04-15
2011-04-01  2024-04-15
2011-04-01  2024-04-15
2021-10-01  2024-04-15


 (7)
 

  -- or --


Summary of all available data for this site
Instantaneous-data availability statement


Temperature, water, degrees Celsius

Most recent instantaneous value: 12.0 04-15-2024   23:30 EDT
Graph of  Temperature, water, degrees Celsius

Add up to 2 more sites and replot for "Temperature, water, degrees Celsius"

?


Create presentation-quality / stand-alone graph.   Subscribe to WaterAlert      

See this graph on the Monitoring Location Pages


Discharge, cubic feet per second

Most recent instantaneous value: 11100 04-15-2024   23:30 EDT
Graph of  Discharge, cubic feet per second

Add up to 2 more sites and replot for "Discharge, cubic feet per second"

?


Create presentation-quality / stand-alone graph.   Subscribe to WaterAlert      

See this graph on the Monitoring Location Pages


Daily discharge, cubic feet per second -- statistics for Apr 16 based on 50 water years of record more
Min
(2012)
25th
percen-
tile
Median Mean 75th
percen-
tile
Most Recent
Instantaneous
Value Apr 16
Max
(1972)
1050 2080 3160 4040 4900 11100 12000


Gage height, feet

Most recent instantaneous value: 7.15 04-15-2024   23:30 EDT
Graph of  Gage height, feet

Add up to 2 more sites and replot for "Gage height, feet"

?


Create presentation-quality / stand-alone graph.   Subscribe to WaterAlert      

See this graph on the Monitoring Location Pages


Specific conductance, water, unfiltered, microsiemens per centimeter at 25 degrees Celsius

Most recent instantaneous value: 205 04-15-2024   23:30 EDT
Graph of  Specific conductance, water, unfiltered, microsiemens per centimeter at 25 degrees Celsius

Add up to 2 more sites and replot for "Specific conductance, water, unfiltered, microsiemens per centimeter at 25 degrees Celsius"

?


Create presentation-quality / stand-alone graph.   Subscribe to WaterAlert      

See this graph on the Monitoring Location Pages


Dissolved oxygen, water, unfiltered, milligrams per liter

Most recent instantaneous value: 10.4 04-15-2024   23:30 EDT
Graph of  Dissolved oxygen, water, unfiltered, milligrams per liter

Add up to 2 more sites and replot for "Dissolved oxygen, water, unfiltered, milligrams per liter"

?


Create presentation-quality / stand-alone graph.   Subscribe to WaterAlert      

See this graph on the Monitoring Location Pages


pH, water, unfiltered, field, standard units

Most recent instantaneous value: 7.1 04-15-2024   23:30 EDT
Graph of  pH, water, unfiltered, field, standard units

Add up to 2 more sites and replot for "pH, water, unfiltered, field, standard units"

?


Create presentation-quality / stand-alone graph.   Subscribe to WaterAlert      

See this graph on the Monitoring Location Pages


Stream water level elevation above NAVD 1988, in feet

Most recent instantaneous value: 837.21 04-15-2024   23:30 EDT
Graph of  Stream water level elevation above NAVD 1988, in feet

Add up to 2 more sites and replot for "Stream water level elevation above NAVD 1988, in feet"

?


Create presentation-quality / stand-alone graph.   Subscribe to WaterAlert      

See this graph on the Monitoring Location Pages